> ## Documentation Index
> Fetch the complete documentation index at: https://ngquct-docs-fix-500-query-results.mintlify.site/llms.txt
> Use this file to discover all available pages before exploring further.
# ER Diagram
> View table relationships as an interactive entity-relationship diagram
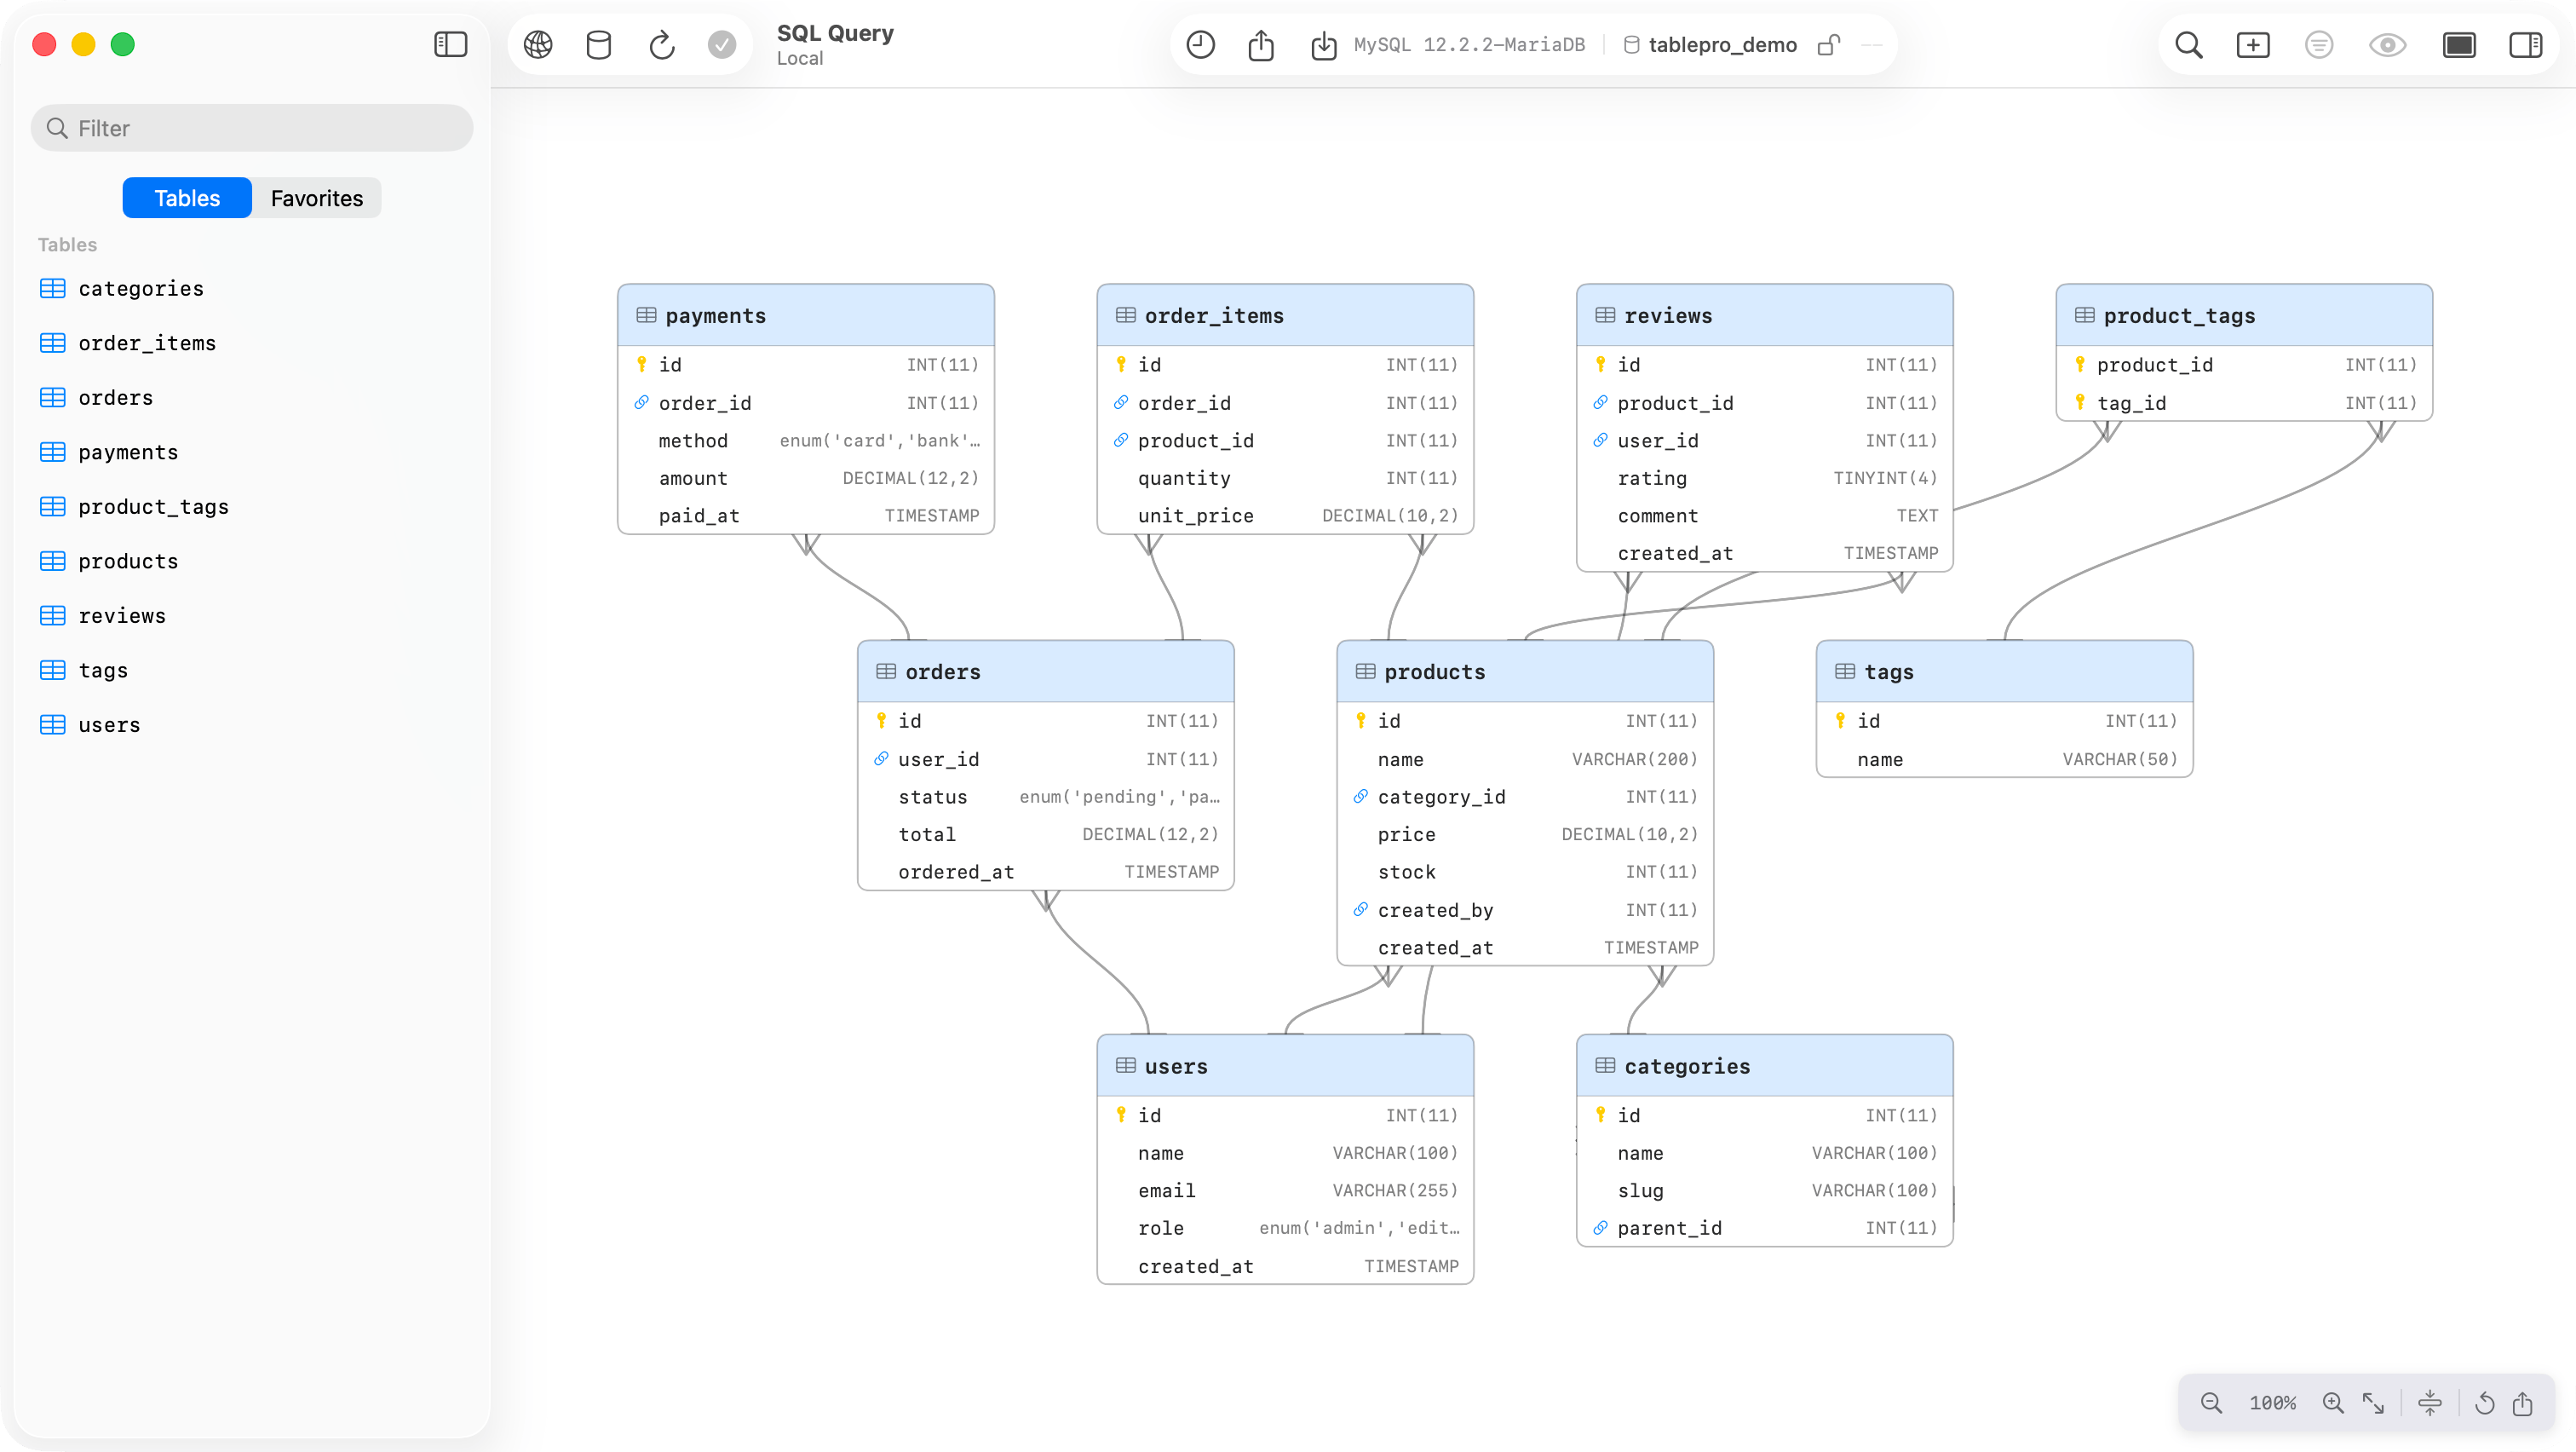
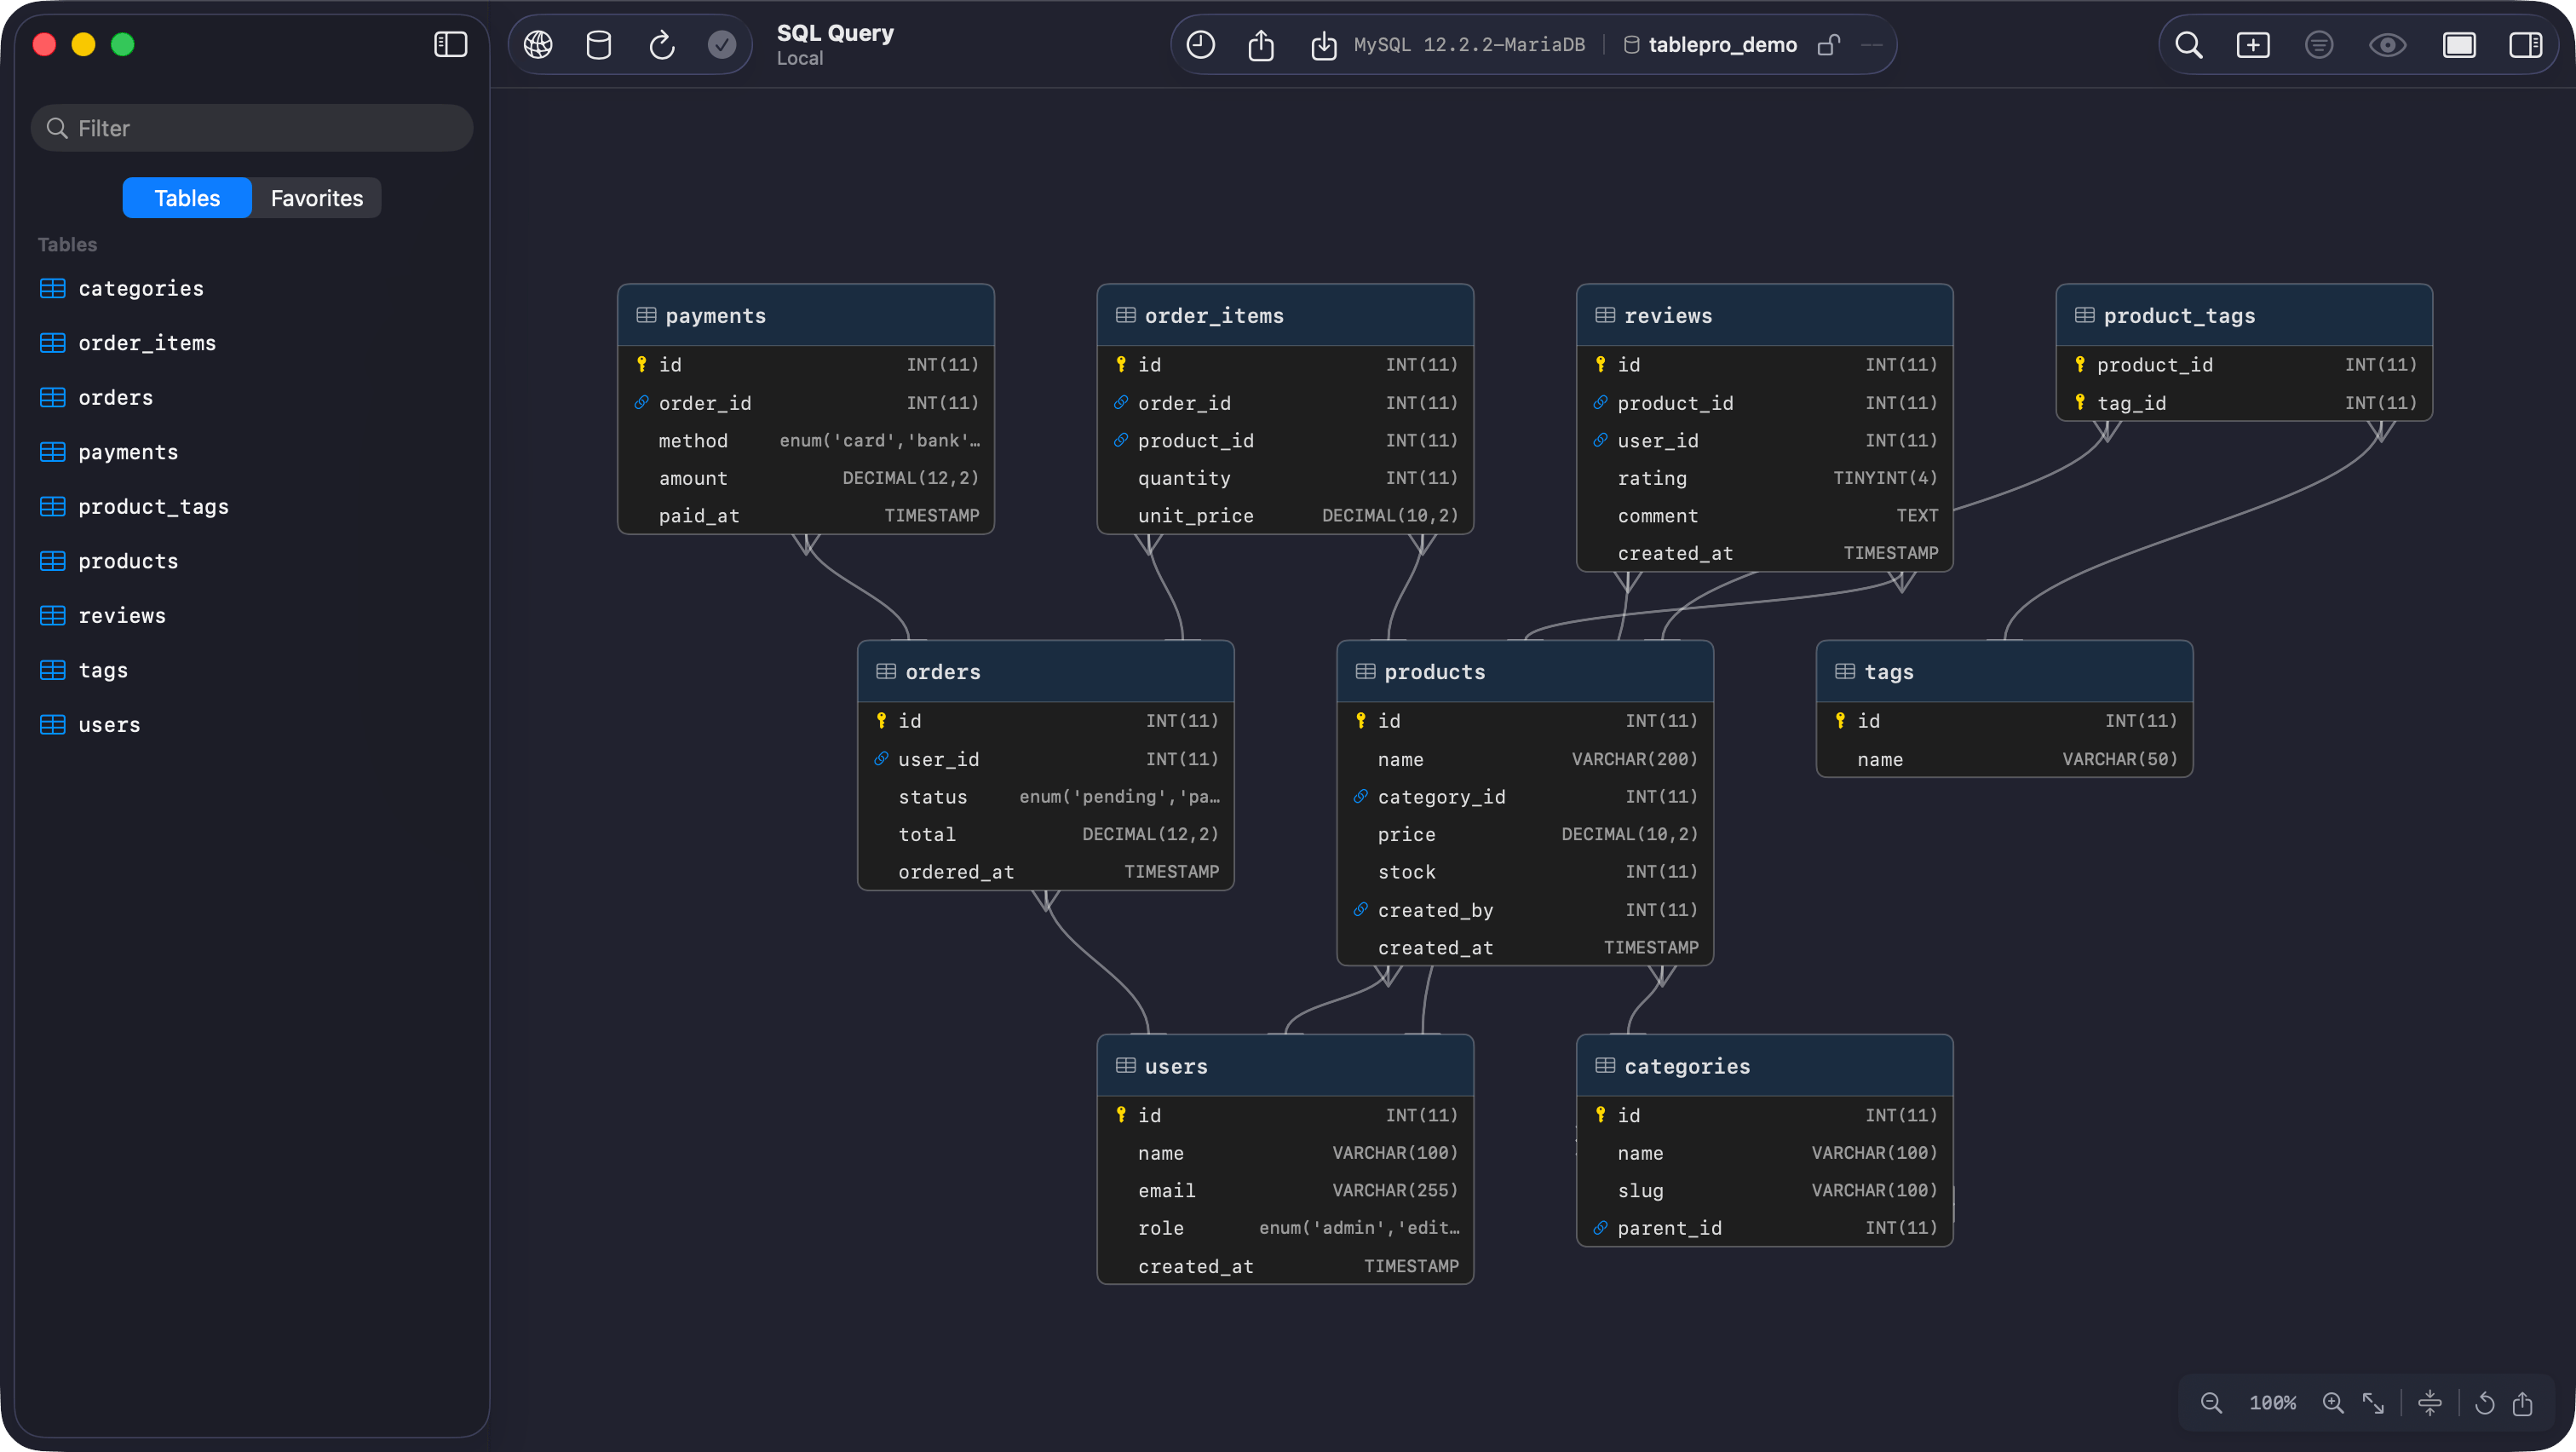
Right-click a table in the sidebar and choose **View ER Diagram**, or use **Database > View ER Diagram**. What opens is the current schema, drawn entirely from the foreign keys the driver reports: tables outside that schema are left out, and a foreign key pointing at one of them is not drawn.
 The diagram is a snapshot taken when the tab opens, and it does not follow later schema changes. After a migration, close the tab and open it again.
## Reading the diagram
Each node lists the table's columns with their types and badges the primary and foreign keys. Tables connected by foreign keys share a header color; a table with no relationships stays uncolored. With the system **Differentiate Without Color** setting on, the tint goes and grouping is left to position.
Edges use crow's foot notation. The referenced end always carries a single bar, "exactly one". The foreign key end shows the cardinality inferred from that column's primary key and unique index data, so an edge from `orders.user_id` to `users.id` forks at `orders` and bars at `users`.
| Foreign key column | Marker | Meaning |
| -------------------- | ------------- | ------------------- |
| Unique and NOT NULL | bar + bar | One-to-one |
| Unique and nullable | bar + circle | Zero-or-one-to-one |
| Not unique, NOT NULL | fork + bar | Many-to-one |
| Not unique, nullable | fork + circle | Zero-or-many-to-one |
## Navigation
| Action | Input |
| ------------- | --------------------------------------------------------- |
| Pan | Click and drag on empty space, or scroll wheel / trackpad |
| Zoom | Pinch on trackpad, or Cmd + scroll wheel |
| Zoom in / out | **+** and **-** toolbar buttons |
| Fit to window | Fit toolbar button |
| Reset to 100% | Click the zoom percentage label |
| Copy diagram | `Cmd+C` |
Drag a node to move it, toward the edge of the viewport to auto-scroll. Positions are saved and survive across sessions; **Reset Layout**, the circular arrow button, puts every table back where the automatic layout had it.
## Compact mode
The compress button in the toolbar cuts every table down to its primary key and foreign key columns, which is what makes a wide schema fit on screen.
## Junction tables
A table whose primary key is made of two foreign keys, `user_roles` and its like, is read as a many-to-many join. **Collapse Junction Tables** is on by default: the junction table is hidden and one many-to-many edge, forked at both ends, joins the two related tables. Turn it off to draw the junction table itself, with its two one-to-many edges and a distinct header icon. The toggle appears only when the schema has junction tables.
## Export
**Export as PNG** renders the whole diagram at twice screen resolution with 40 points of padding, whatever the current zoom and scroll position, and saves it as `er-diagram.png`. `Cmd+C` puts the same image on the clipboard. Compact mode and expanded junction tables carry into the render, so set the view up first.
**Export as SQL** opens a query tab with `CREATE TABLE` and foreign key statements for the diagram's tables in the connection's dialect. SQLite inlines the foreign keys; other engines add them afterwards with `ALTER TABLE … ADD CONSTRAINT`, so the script survives circular references.
## Database support
Edges are drawn on MySQL, MariaDB, PostgreSQL, Redshift, CockroachDB, PGlite, SQLite, SQL Server, Oracle, DuckDB, Snowflake, libSQL, and Cloudflare D1. Every other driver reports no foreign keys at all, so the command still opens a diagram and every table in it arrives unconnected.
The diagram is a snapshot taken when the tab opens, and it does not follow later schema changes. After a migration, close the tab and open it again.
## Reading the diagram
Each node lists the table's columns with their types and badges the primary and foreign keys. Tables connected by foreign keys share a header color; a table with no relationships stays uncolored. With the system **Differentiate Without Color** setting on, the tint goes and grouping is left to position.
Edges use crow's foot notation. The referenced end always carries a single bar, "exactly one". The foreign key end shows the cardinality inferred from that column's primary key and unique index data, so an edge from `orders.user_id` to `users.id` forks at `orders` and bars at `users`.
| Foreign key column | Marker | Meaning |
| -------------------- | ------------- | ------------------- |
| Unique and NOT NULL | bar + bar | One-to-one |
| Unique and nullable | bar + circle | Zero-or-one-to-one |
| Not unique, NOT NULL | fork + bar | Many-to-one |
| Not unique, nullable | fork + circle | Zero-or-many-to-one |
## Navigation
| Action | Input |
| ------------- | --------------------------------------------------------- |
| Pan | Click and drag on empty space, or scroll wheel / trackpad |
| Zoom | Pinch on trackpad, or Cmd + scroll wheel |
| Zoom in / out | **+** and **-** toolbar buttons |
| Fit to window | Fit toolbar button |
| Reset to 100% | Click the zoom percentage label |
| Copy diagram | `Cmd+C` |
Drag a node to move it, toward the edge of the viewport to auto-scroll. Positions are saved and survive across sessions; **Reset Layout**, the circular arrow button, puts every table back where the automatic layout had it.
## Compact mode
The compress button in the toolbar cuts every table down to its primary key and foreign key columns, which is what makes a wide schema fit on screen.
## Junction tables
A table whose primary key is made of two foreign keys, `user_roles` and its like, is read as a many-to-many join. **Collapse Junction Tables** is on by default: the junction table is hidden and one many-to-many edge, forked at both ends, joins the two related tables. Turn it off to draw the junction table itself, with its two one-to-many edges and a distinct header icon. The toggle appears only when the schema has junction tables.
## Export
**Export as PNG** renders the whole diagram at twice screen resolution with 40 points of padding, whatever the current zoom and scroll position, and saves it as `er-diagram.png`. `Cmd+C` puts the same image on the clipboard. Compact mode and expanded junction tables carry into the render, so set the view up first.
**Export as SQL** opens a query tab with `CREATE TABLE` and foreign key statements for the diagram's tables in the connection's dialect. SQLite inlines the foreign keys; other engines add them afterwards with `ALTER TABLE … ADD CONSTRAINT`, so the script survives circular references.
## Database support
Edges are drawn on MySQL, MariaDB, PostgreSQL, Redshift, CockroachDB, PGlite, SQLite, SQL Server, Oracle, DuckDB, Snowflake, libSQL, and Cloudflare D1. Every other driver reports no foreign keys at all, so the command still opens a diagram and every table in it arrives unconnected.