

Cmd+Option+E); engines with a single variant show a plain button instead.
The plan arrives as a result tab next to your query results, so going back to the data costs nothing, and pinning that tab keeps a plan while you try another query. Typing an EXPLAIN statement in the editor and running it opens the same viewer.
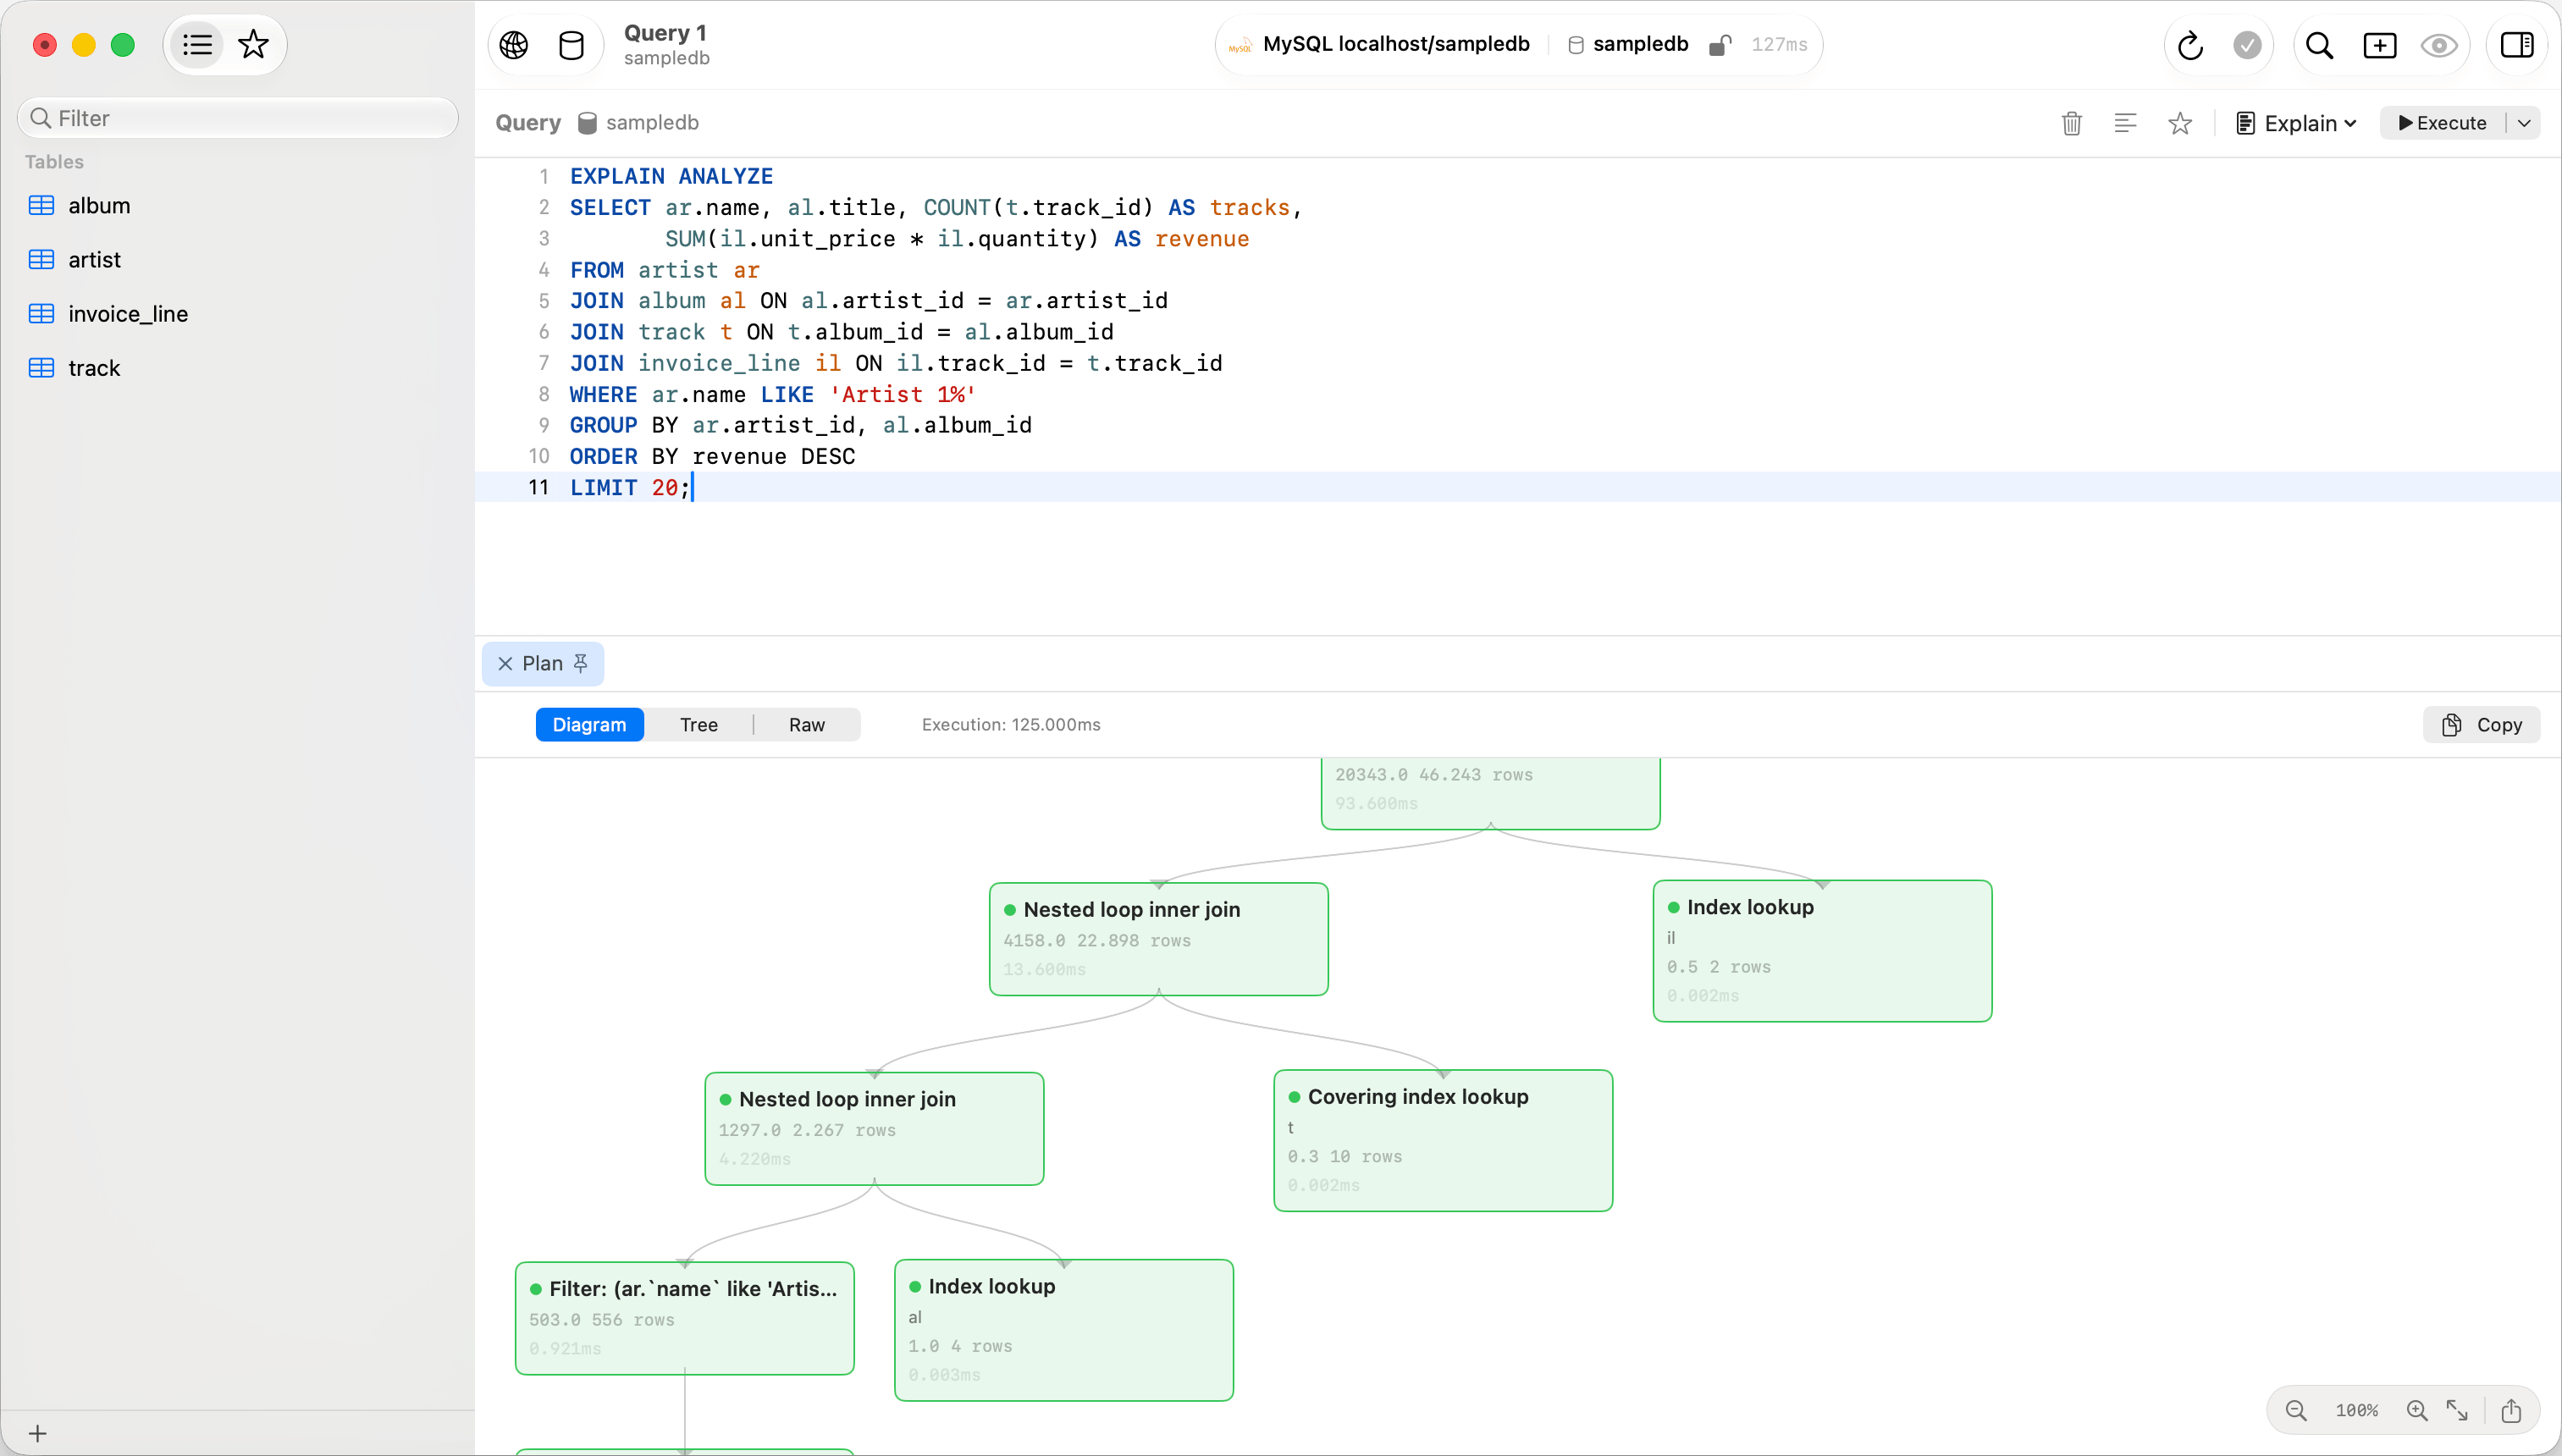
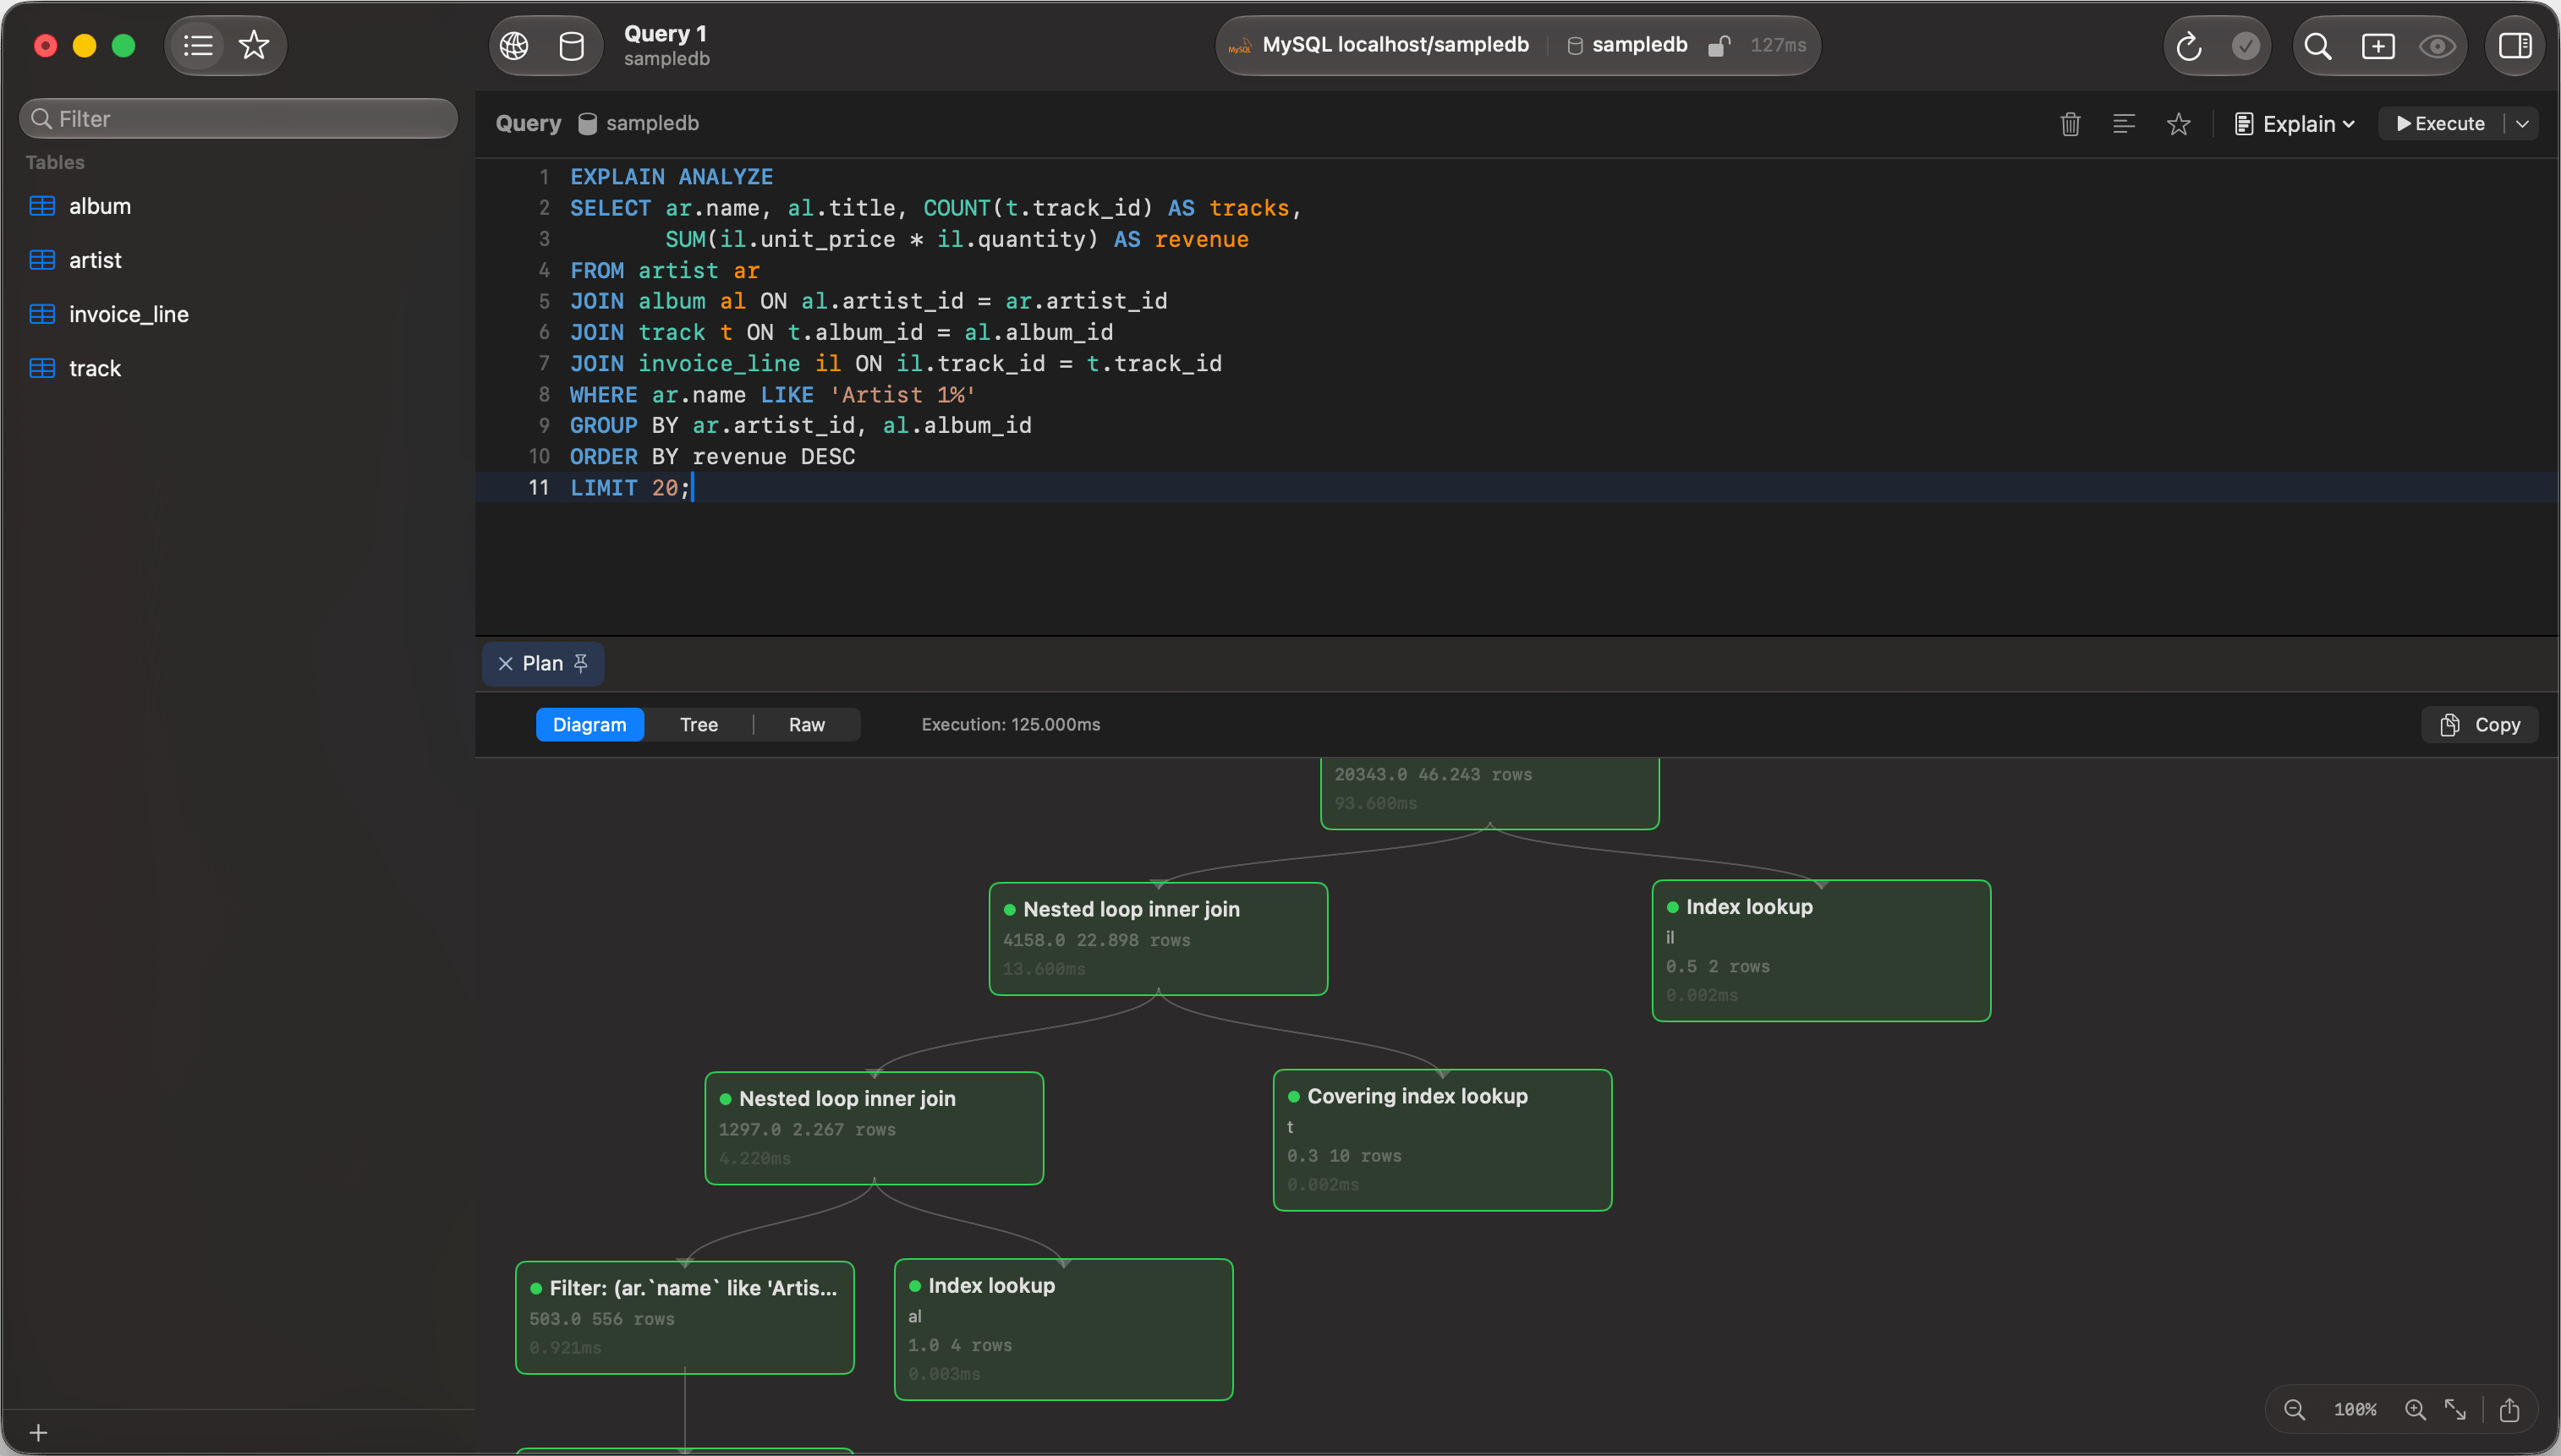
MySQL EXPLAIN ANALYZE diagram
Finding the expensive step
Every node carries a badge for its own share of the plan’s total cost, taken after its children’s cost is subtracted, so it marks where the work sits rather than where it accumulates.
Shape escalates alongside color, so the badge still reads with the system Differentiate Without Color setting on.
Then compare estimate against measurement. A node whose Rows estimate is orders of magnitude from its Actual Rows is why the planner chose that shape, so refresh the table’s statistics before rewriting the query. On PostgreSQL a Loops value above 1 means the node ran once per row of its parent, which makes Actual Time the per-loop figure rather than the total.
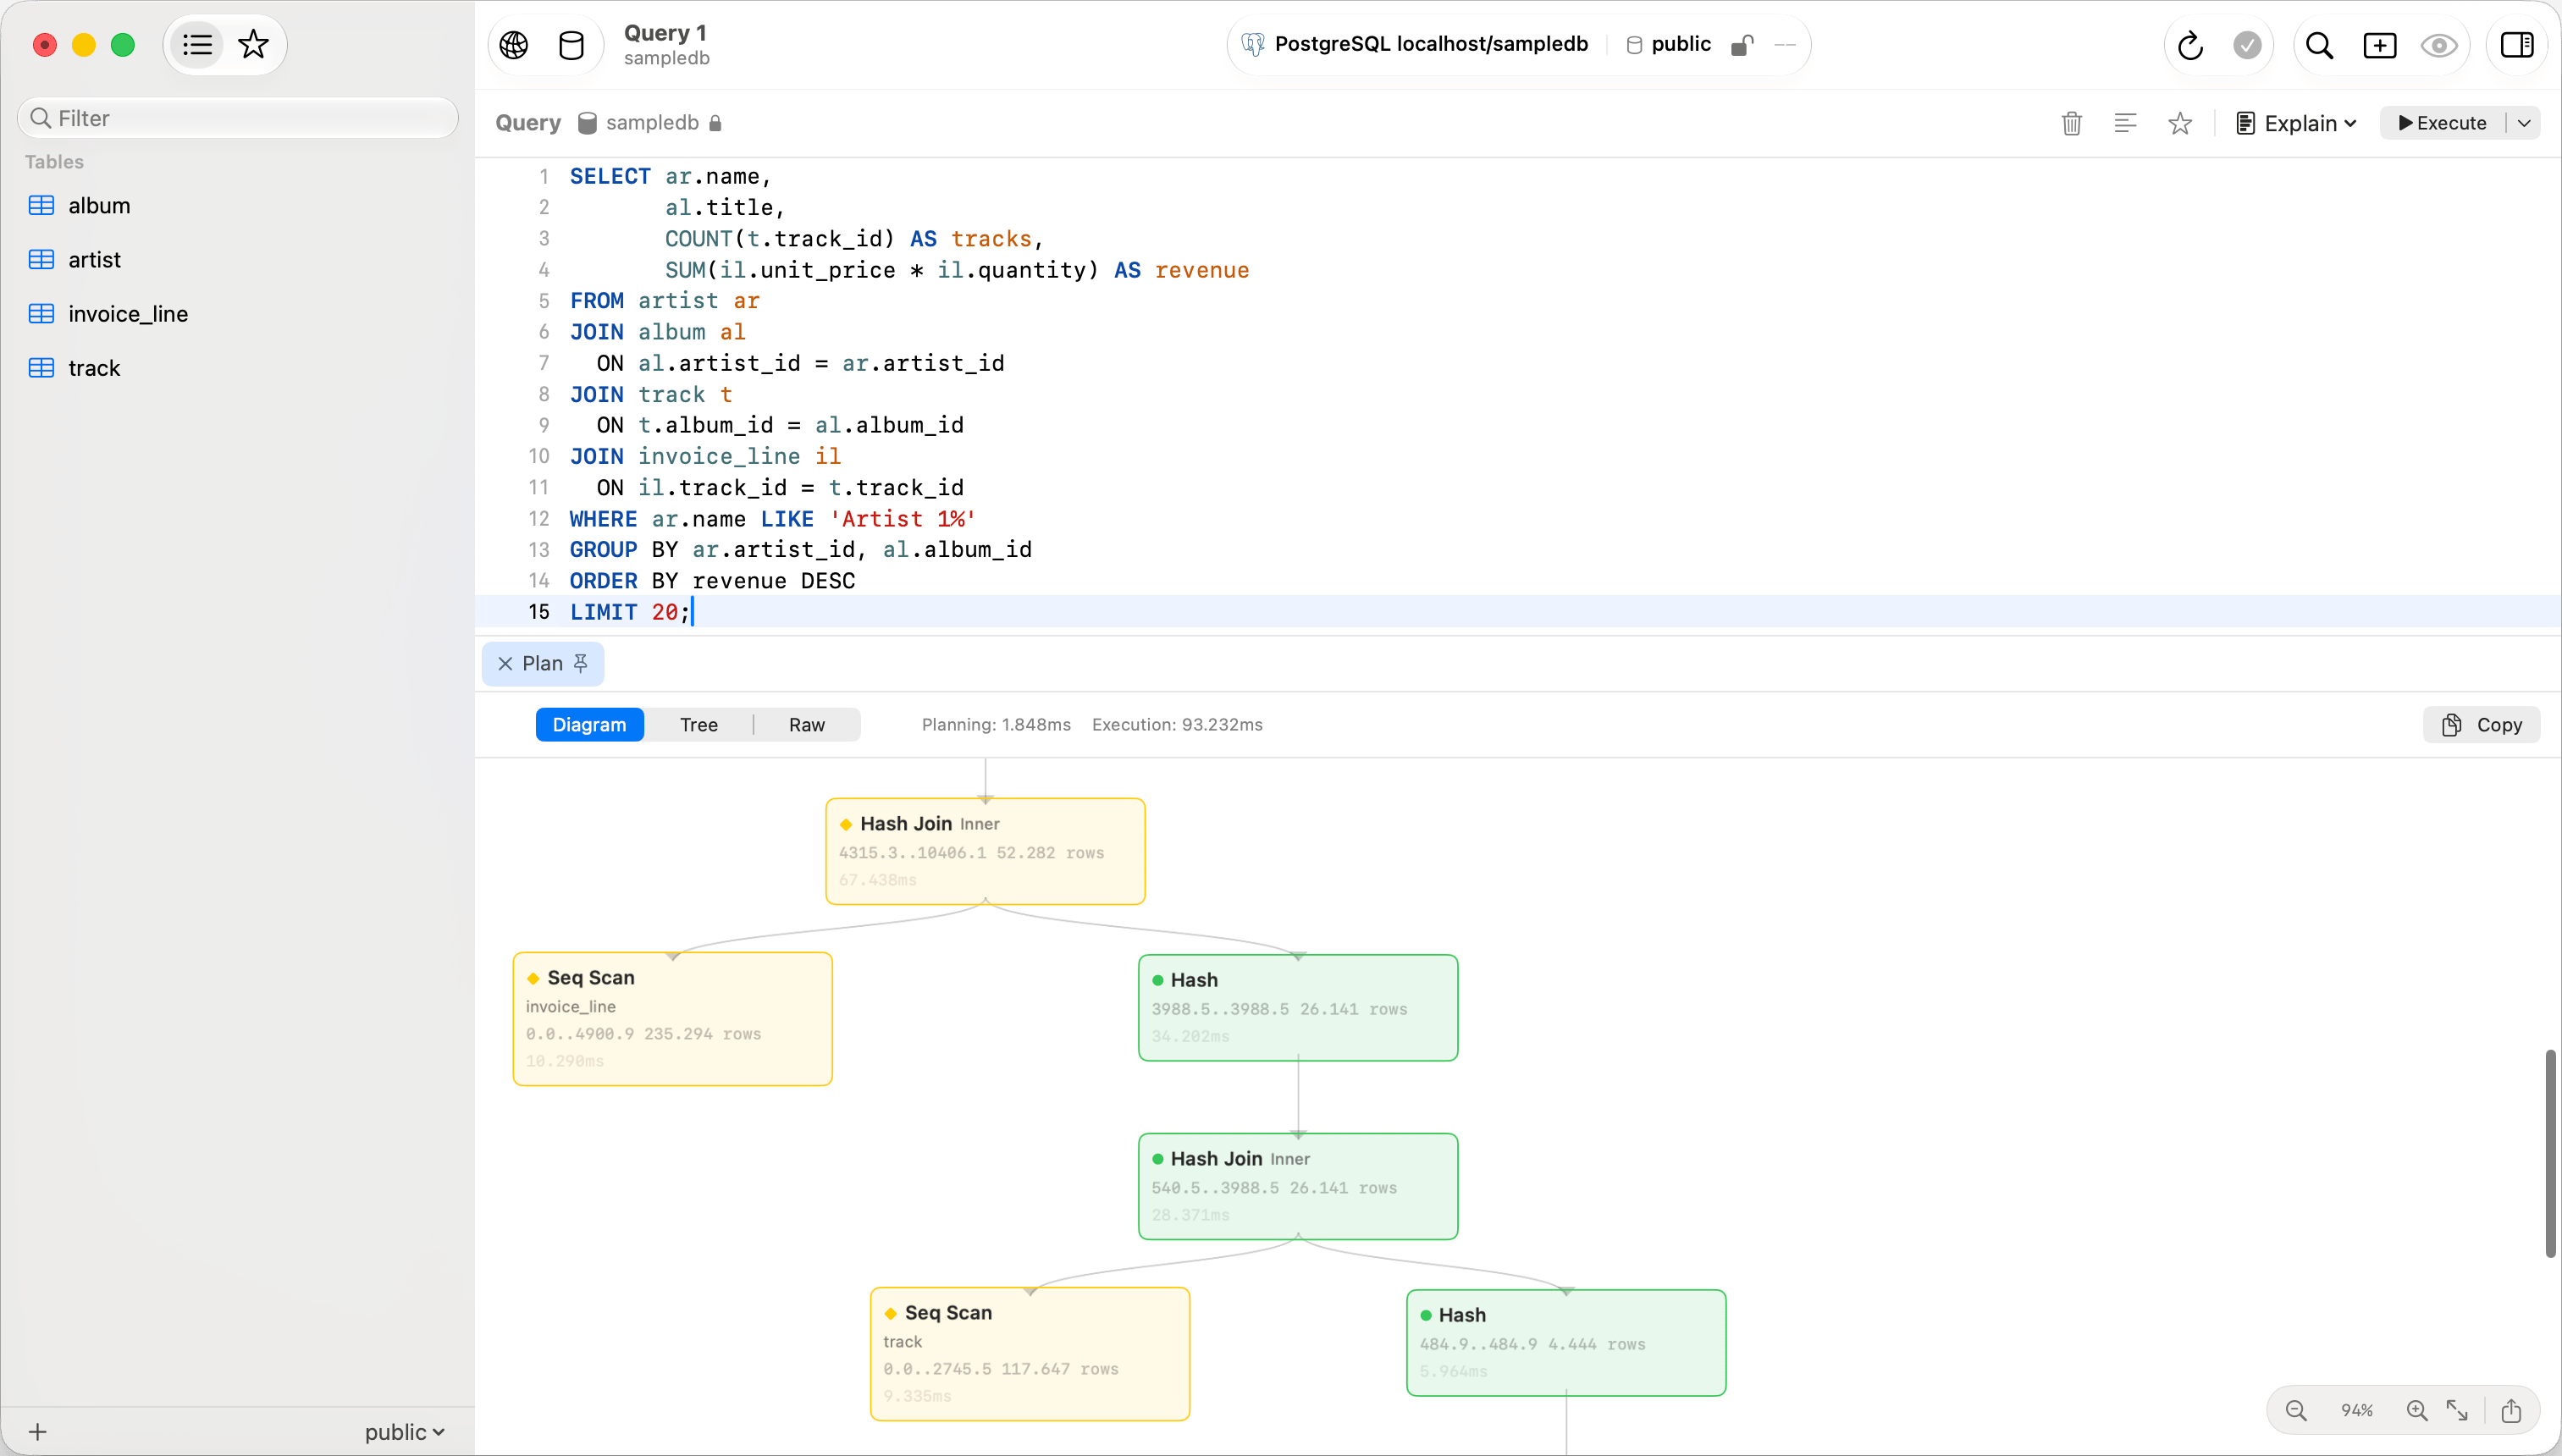
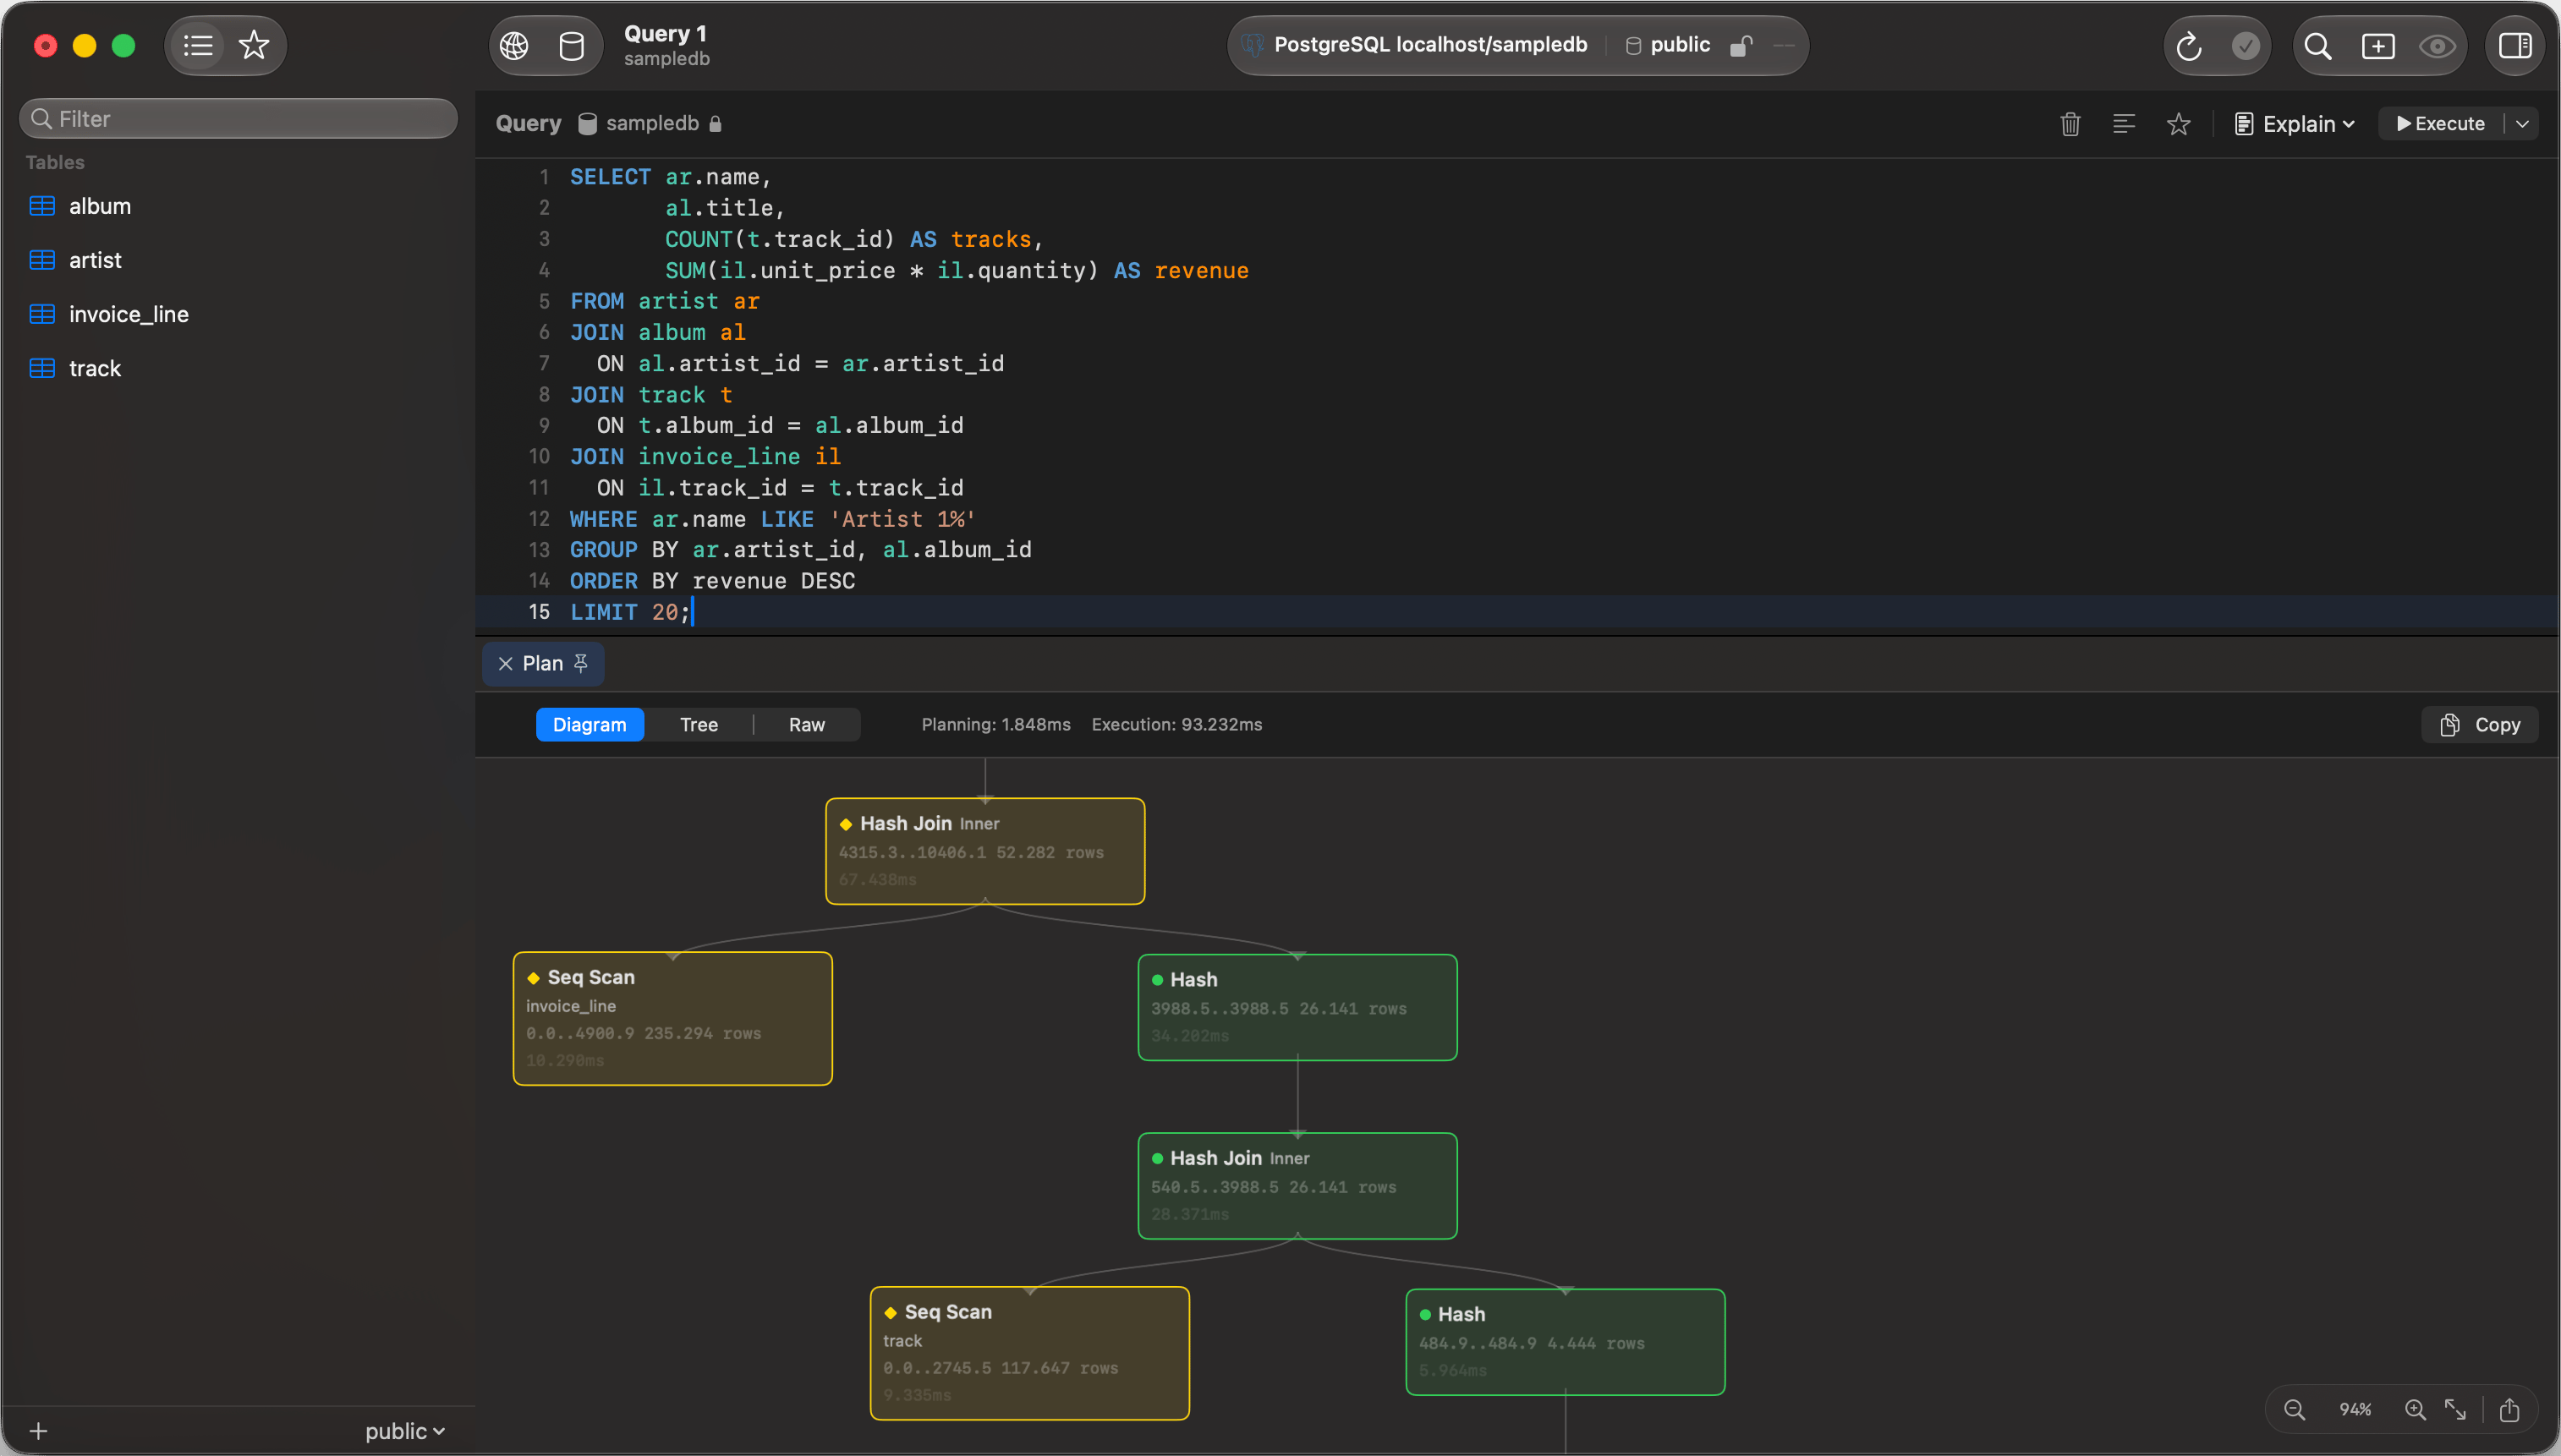
EXPLAIN diagram view
View modes
The segmented control above the results switches between three views. A plan the parser cannot read as a tree has no control at all and shows the raw output under a banner saying so.Diagram
Boxes joined by arrows, top to bottom. Zoom with a trackpad pinch, a two-finger double tap, or Cmd and scroll; the controls in the bottom-right corner zoom, reset to 100%, and fit the plan to the window. Right-click copies a step, and the export button saves the diagram as a PNG.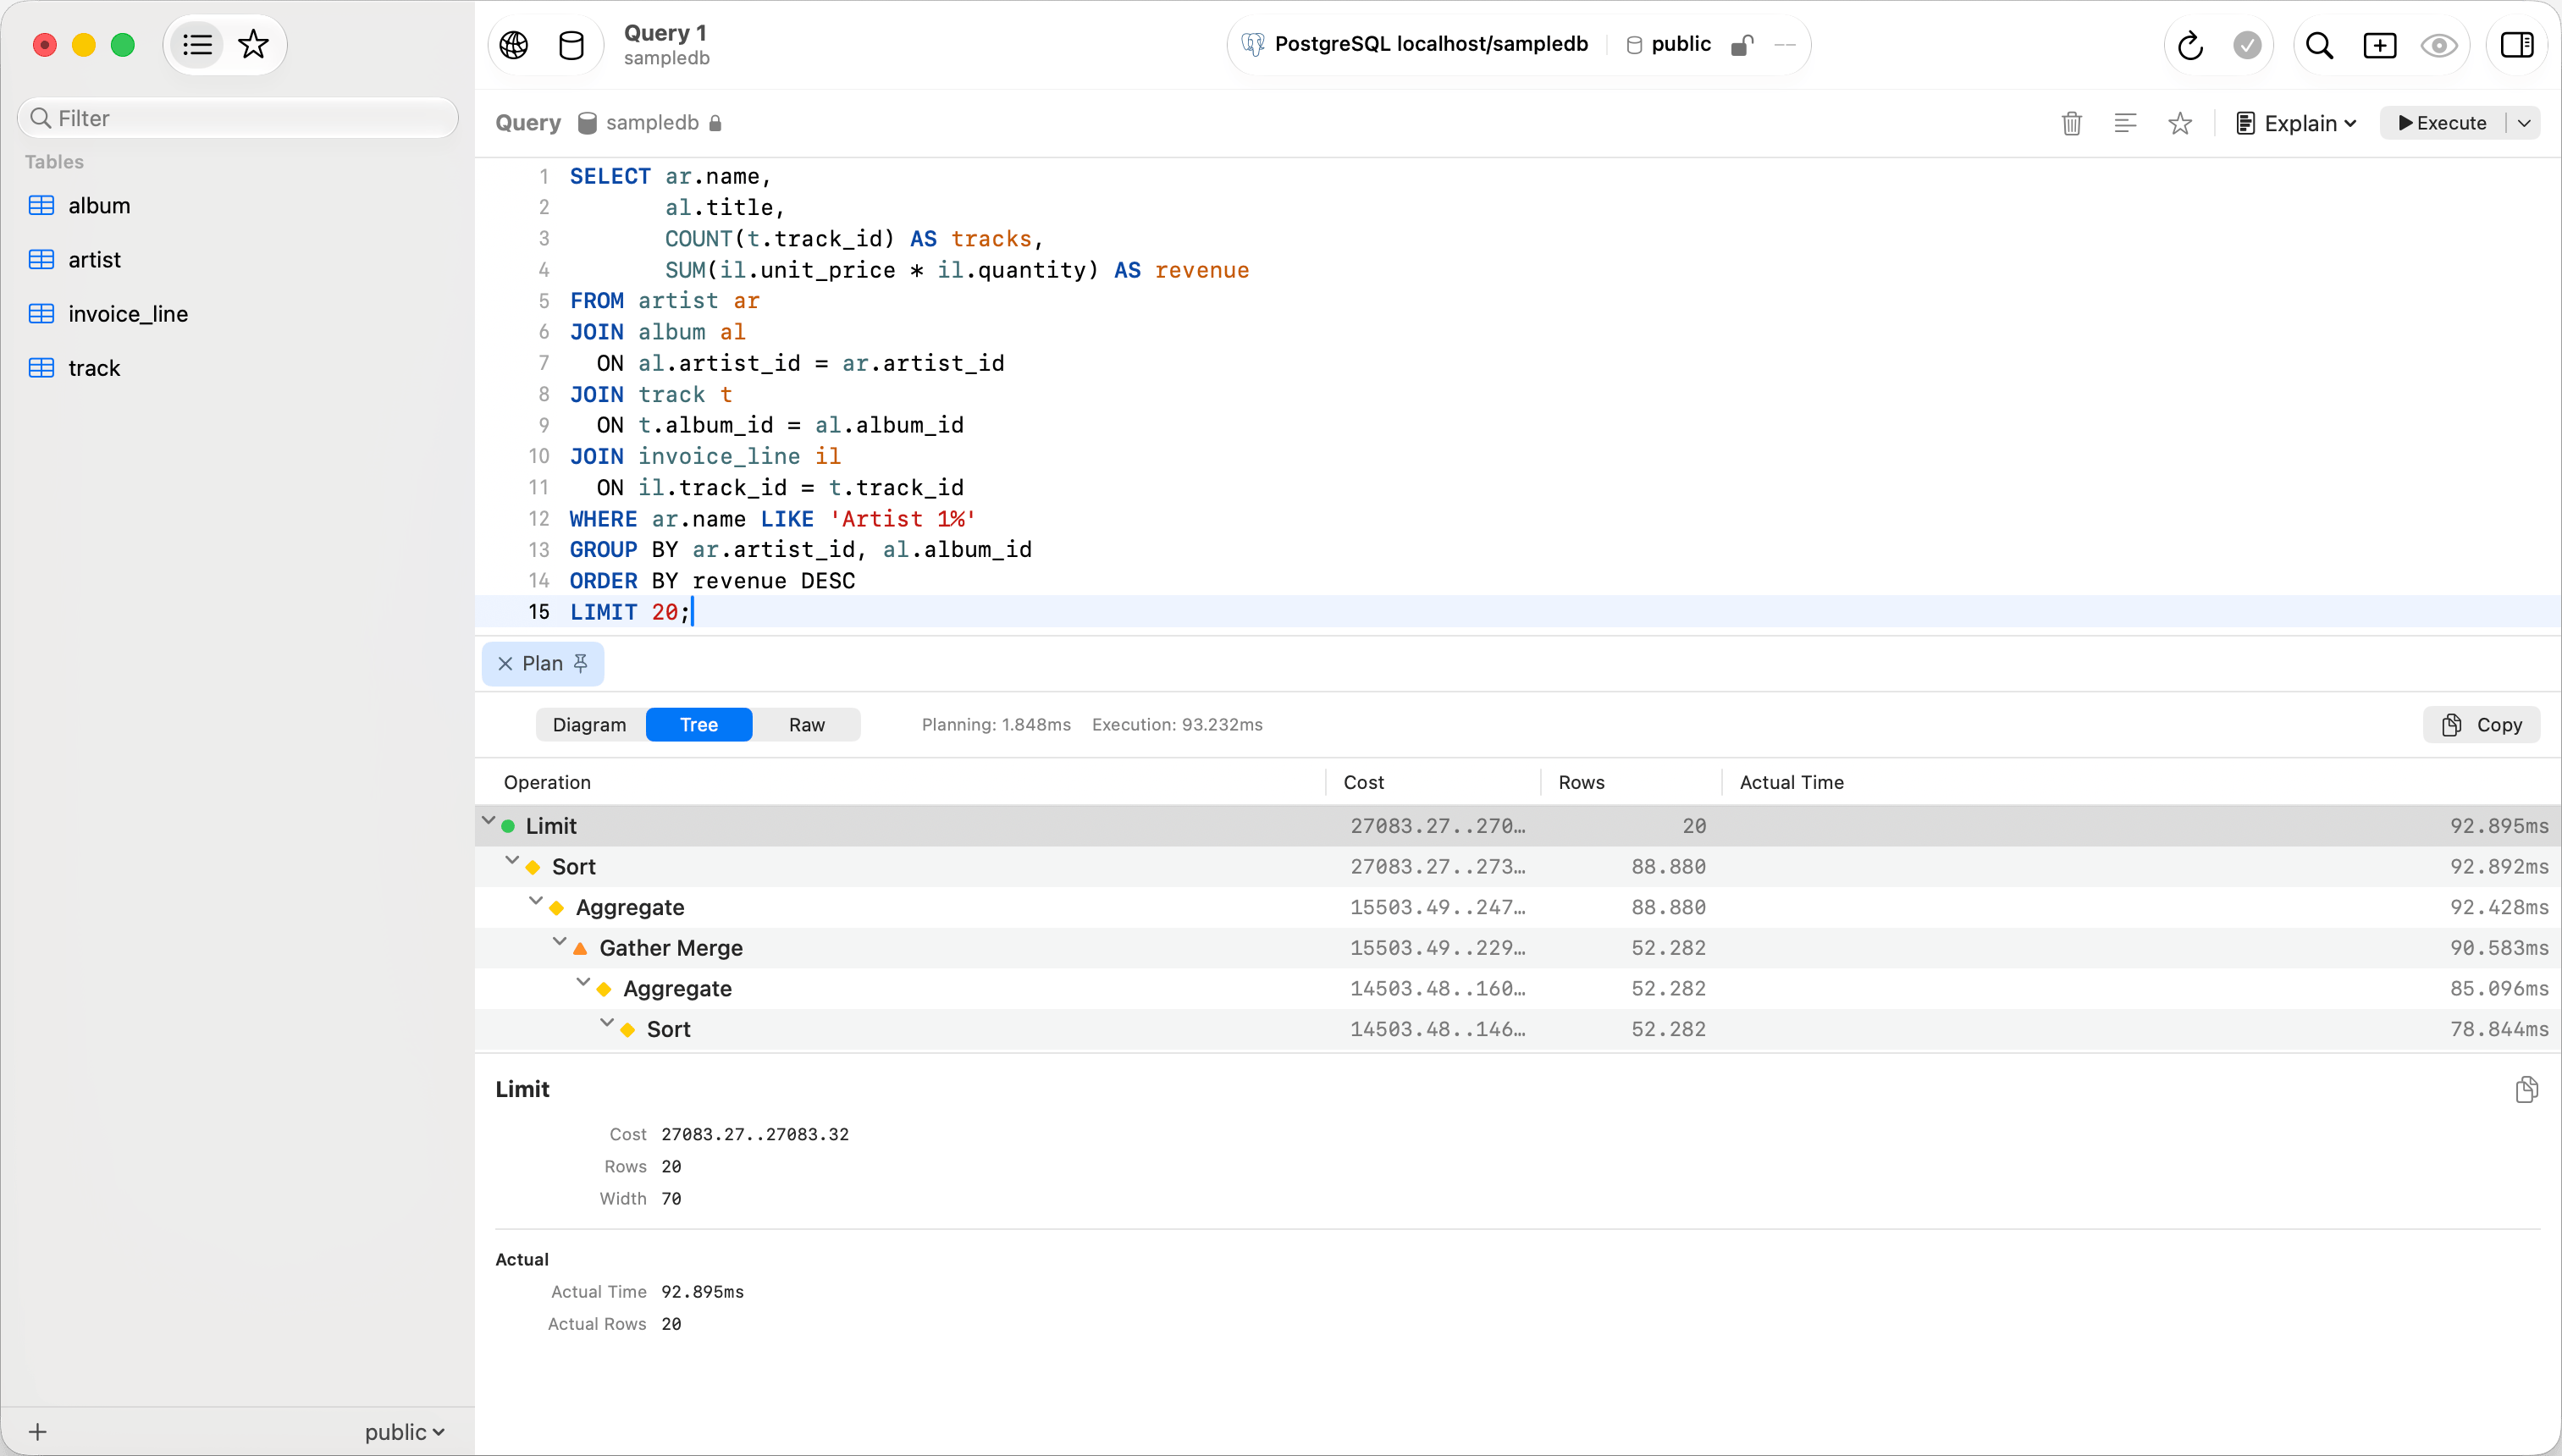
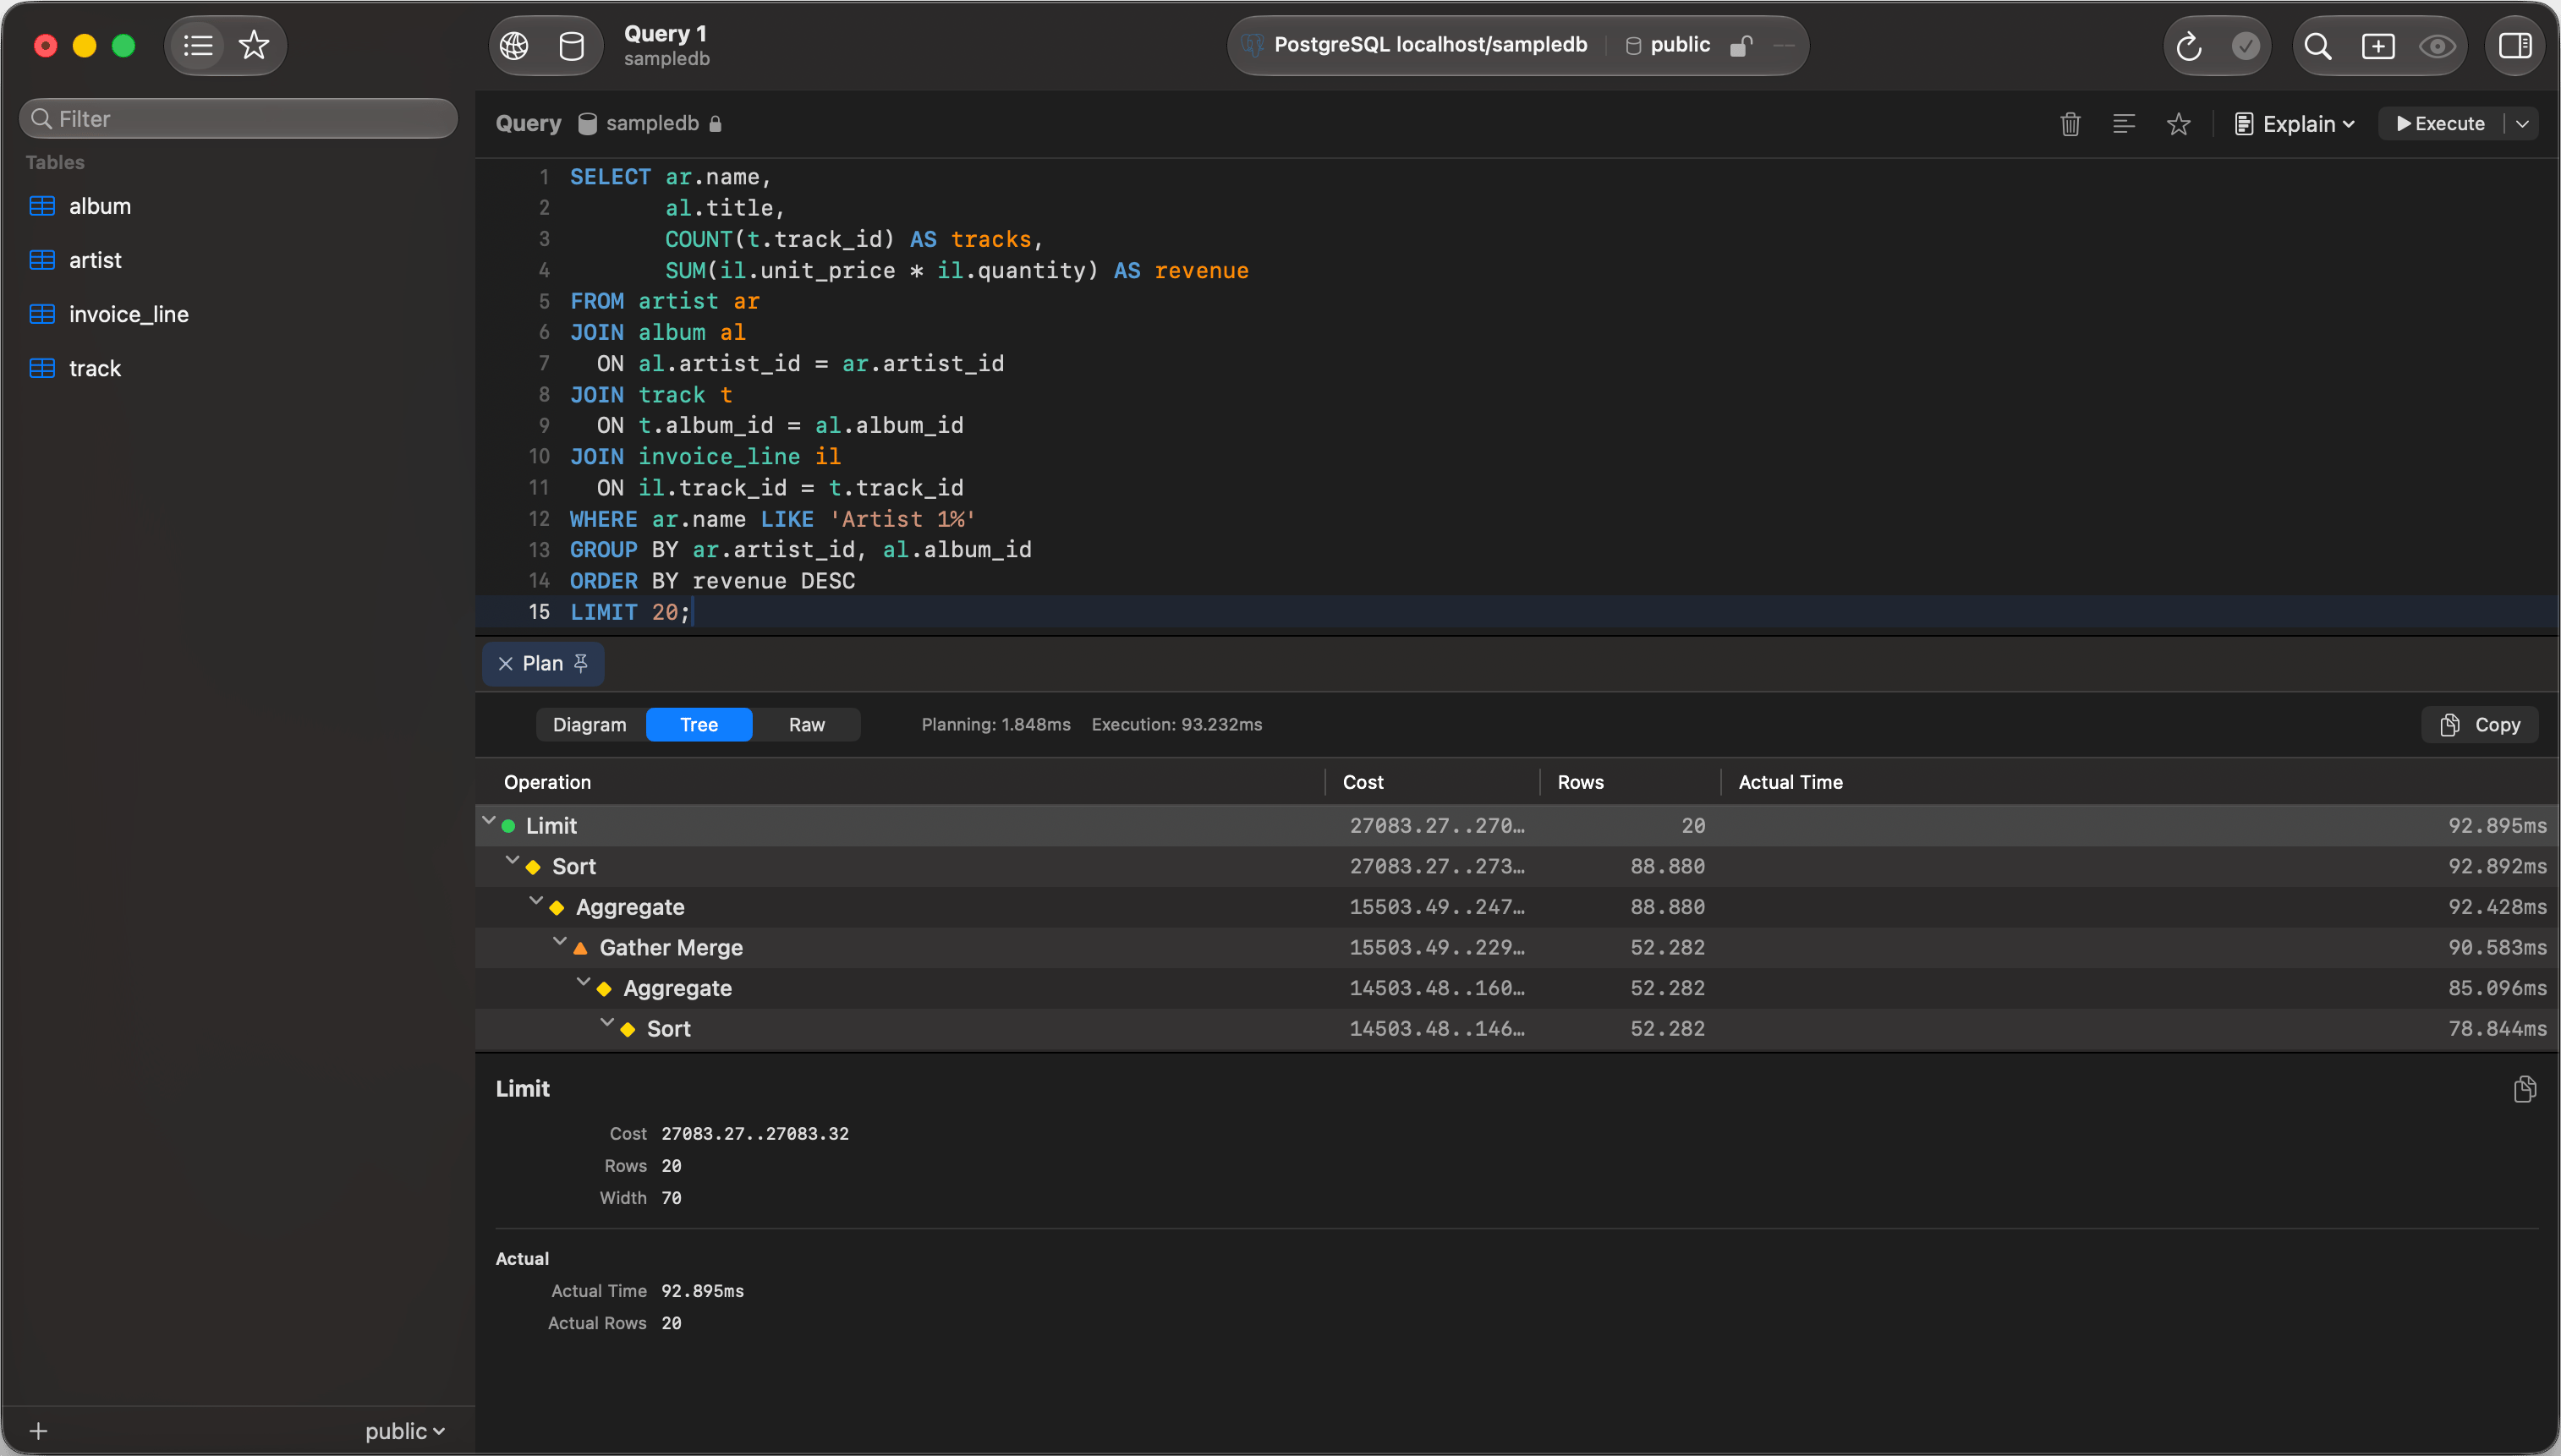
EXPLAIN tree view
Tree
An expandable outline with Operation, Cost, Rows, and Actual Time columns. Drag a column edge to resize it and the width is remembered. Clicking a header sorts the steps under each parent without flattening the plan. Arrow keys move between steps, right-click copies one, and the divider resizes the detail panel.Raw
The original EXPLAIN output as text, with a copy button and a font size stepper. Planning and execution times, where the plan reports them, sit beside the view switcher in every mode.Node details
Selecting a node in either view fills the detail panel:
Properties the driver reported as false or zero are left out of Details.