

PROCESS privilege gets only its own connections in the session list. A PostgreSQL role that is neither a superuser nor a member of pg_monitor gets everyone’s backends with the Query column blank. An empty or half-blank dashboard is nearly always a privilege, not a fault.
Open it from Database > Server Dashboard. A Dashboard toolbar button is available too: right-click the toolbar, choose Customize Toolbar, and drag it in.
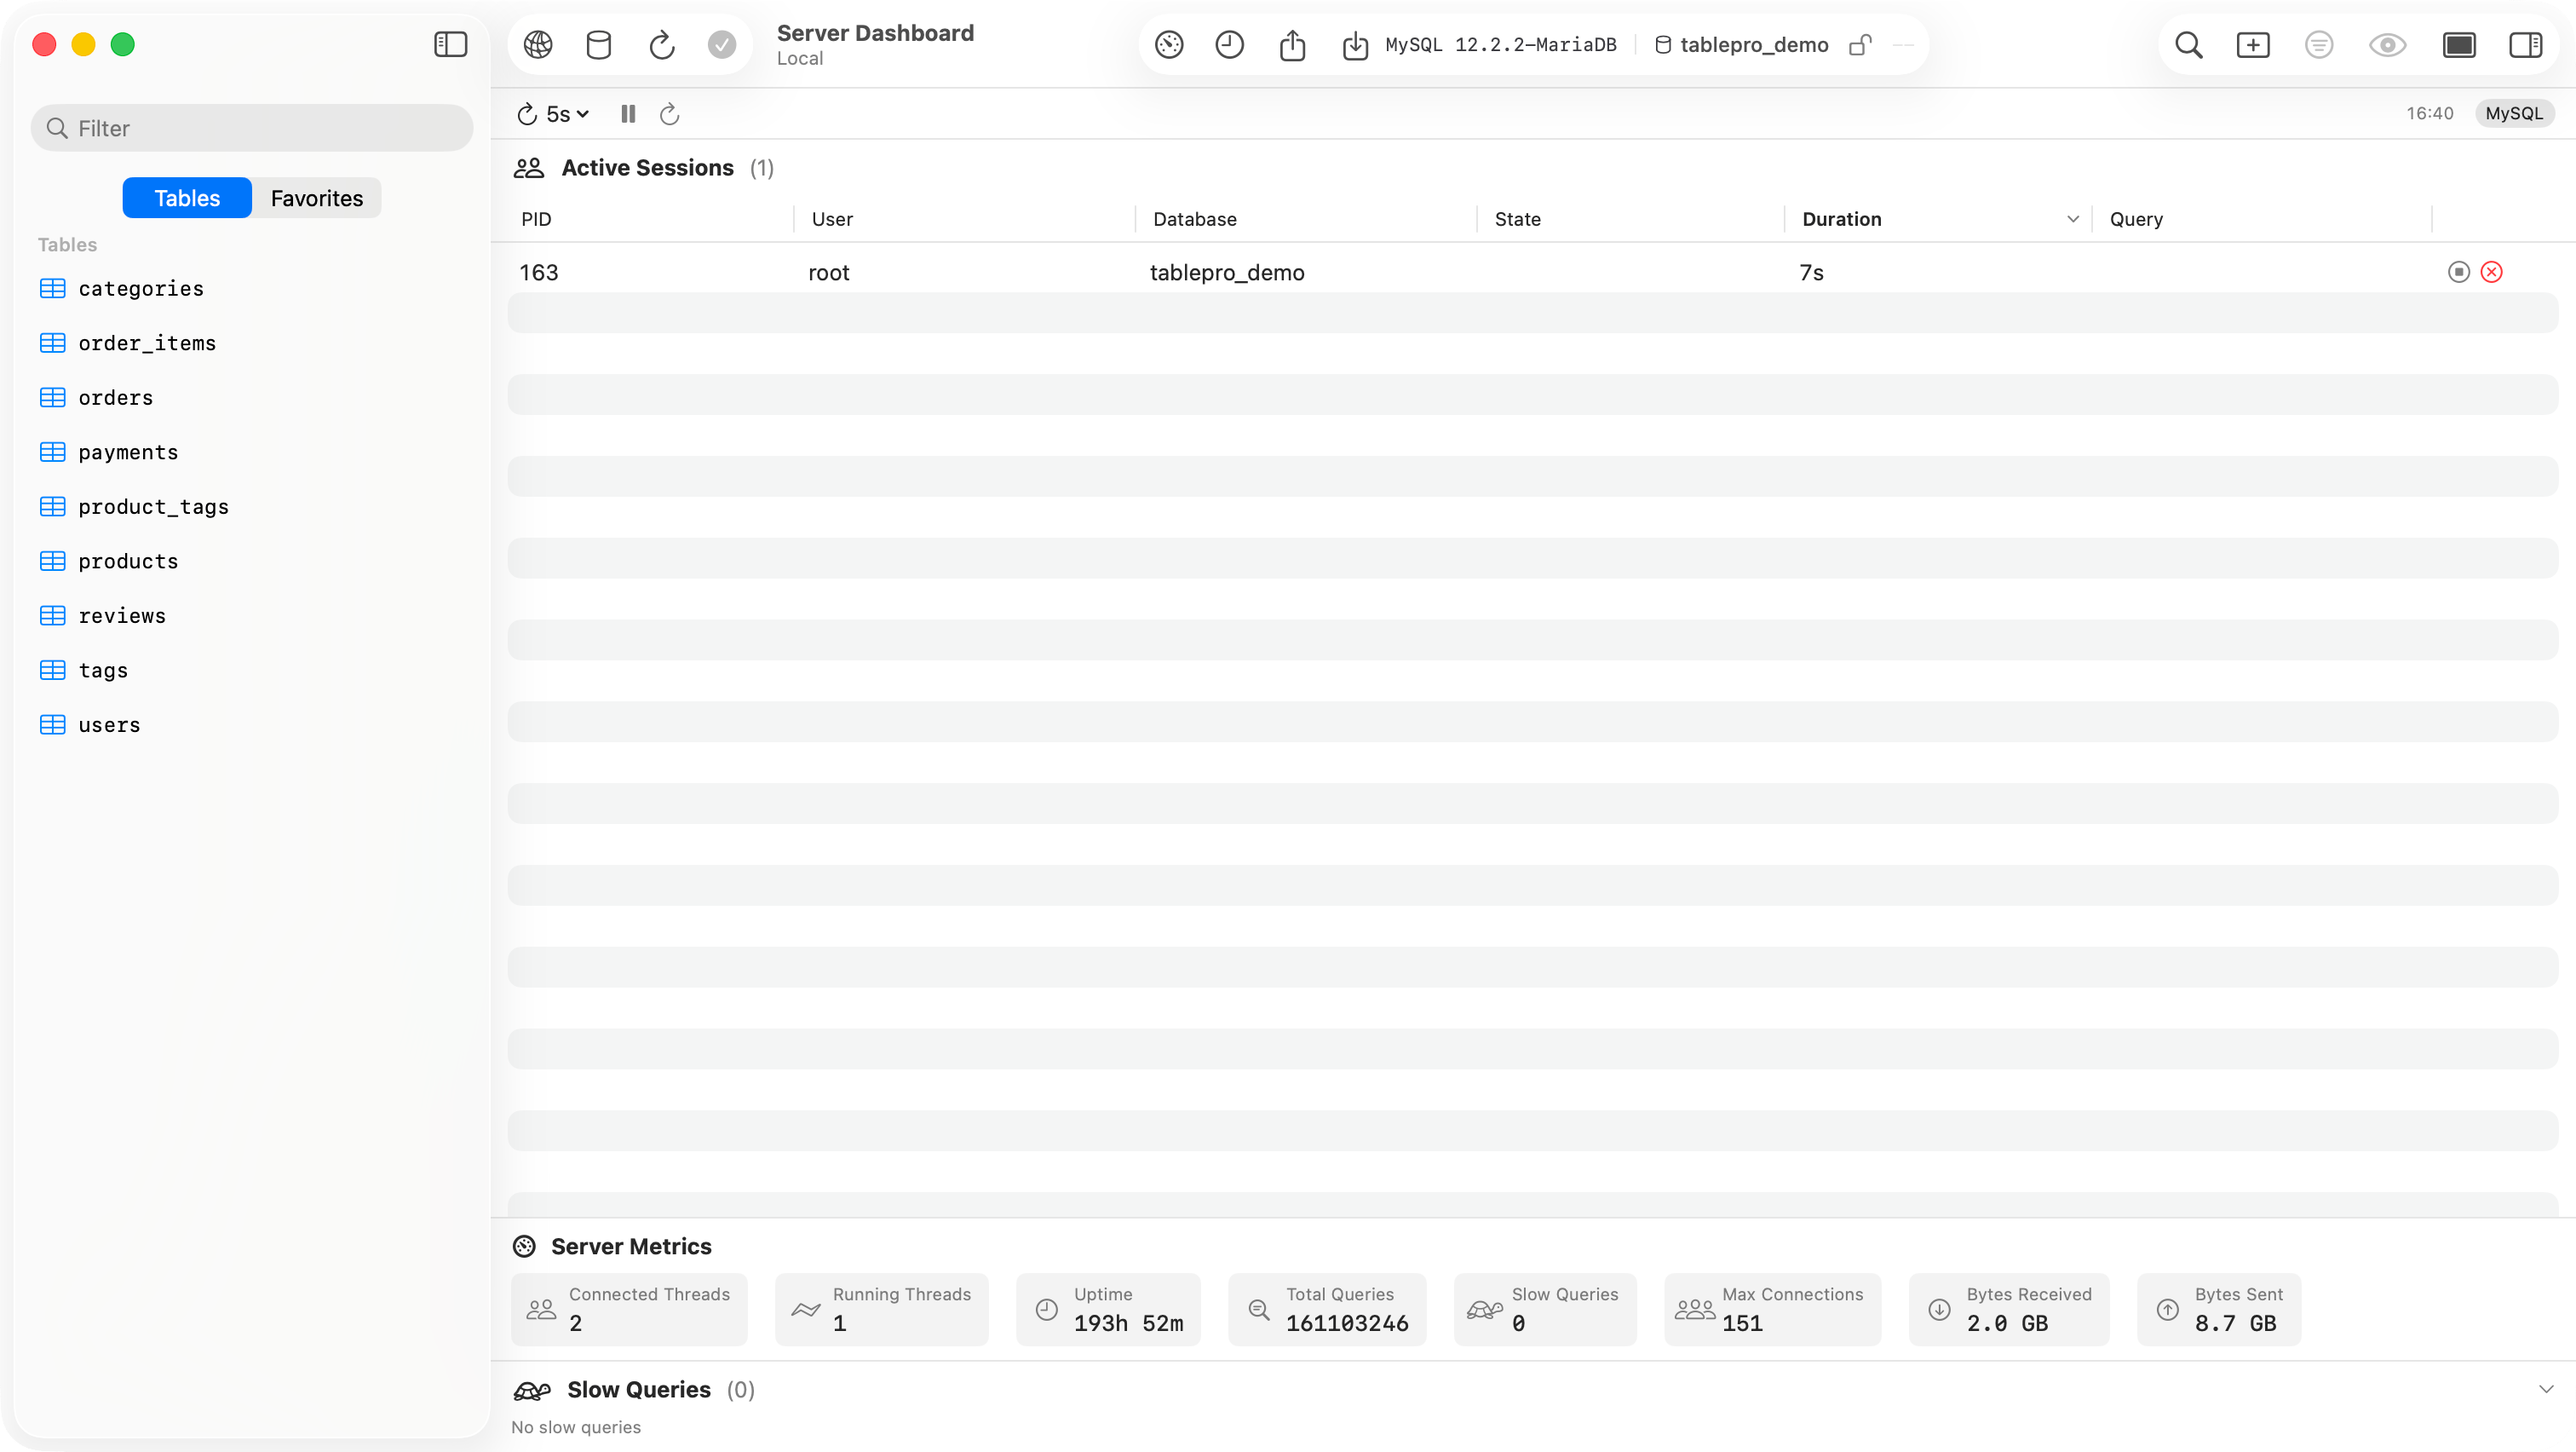
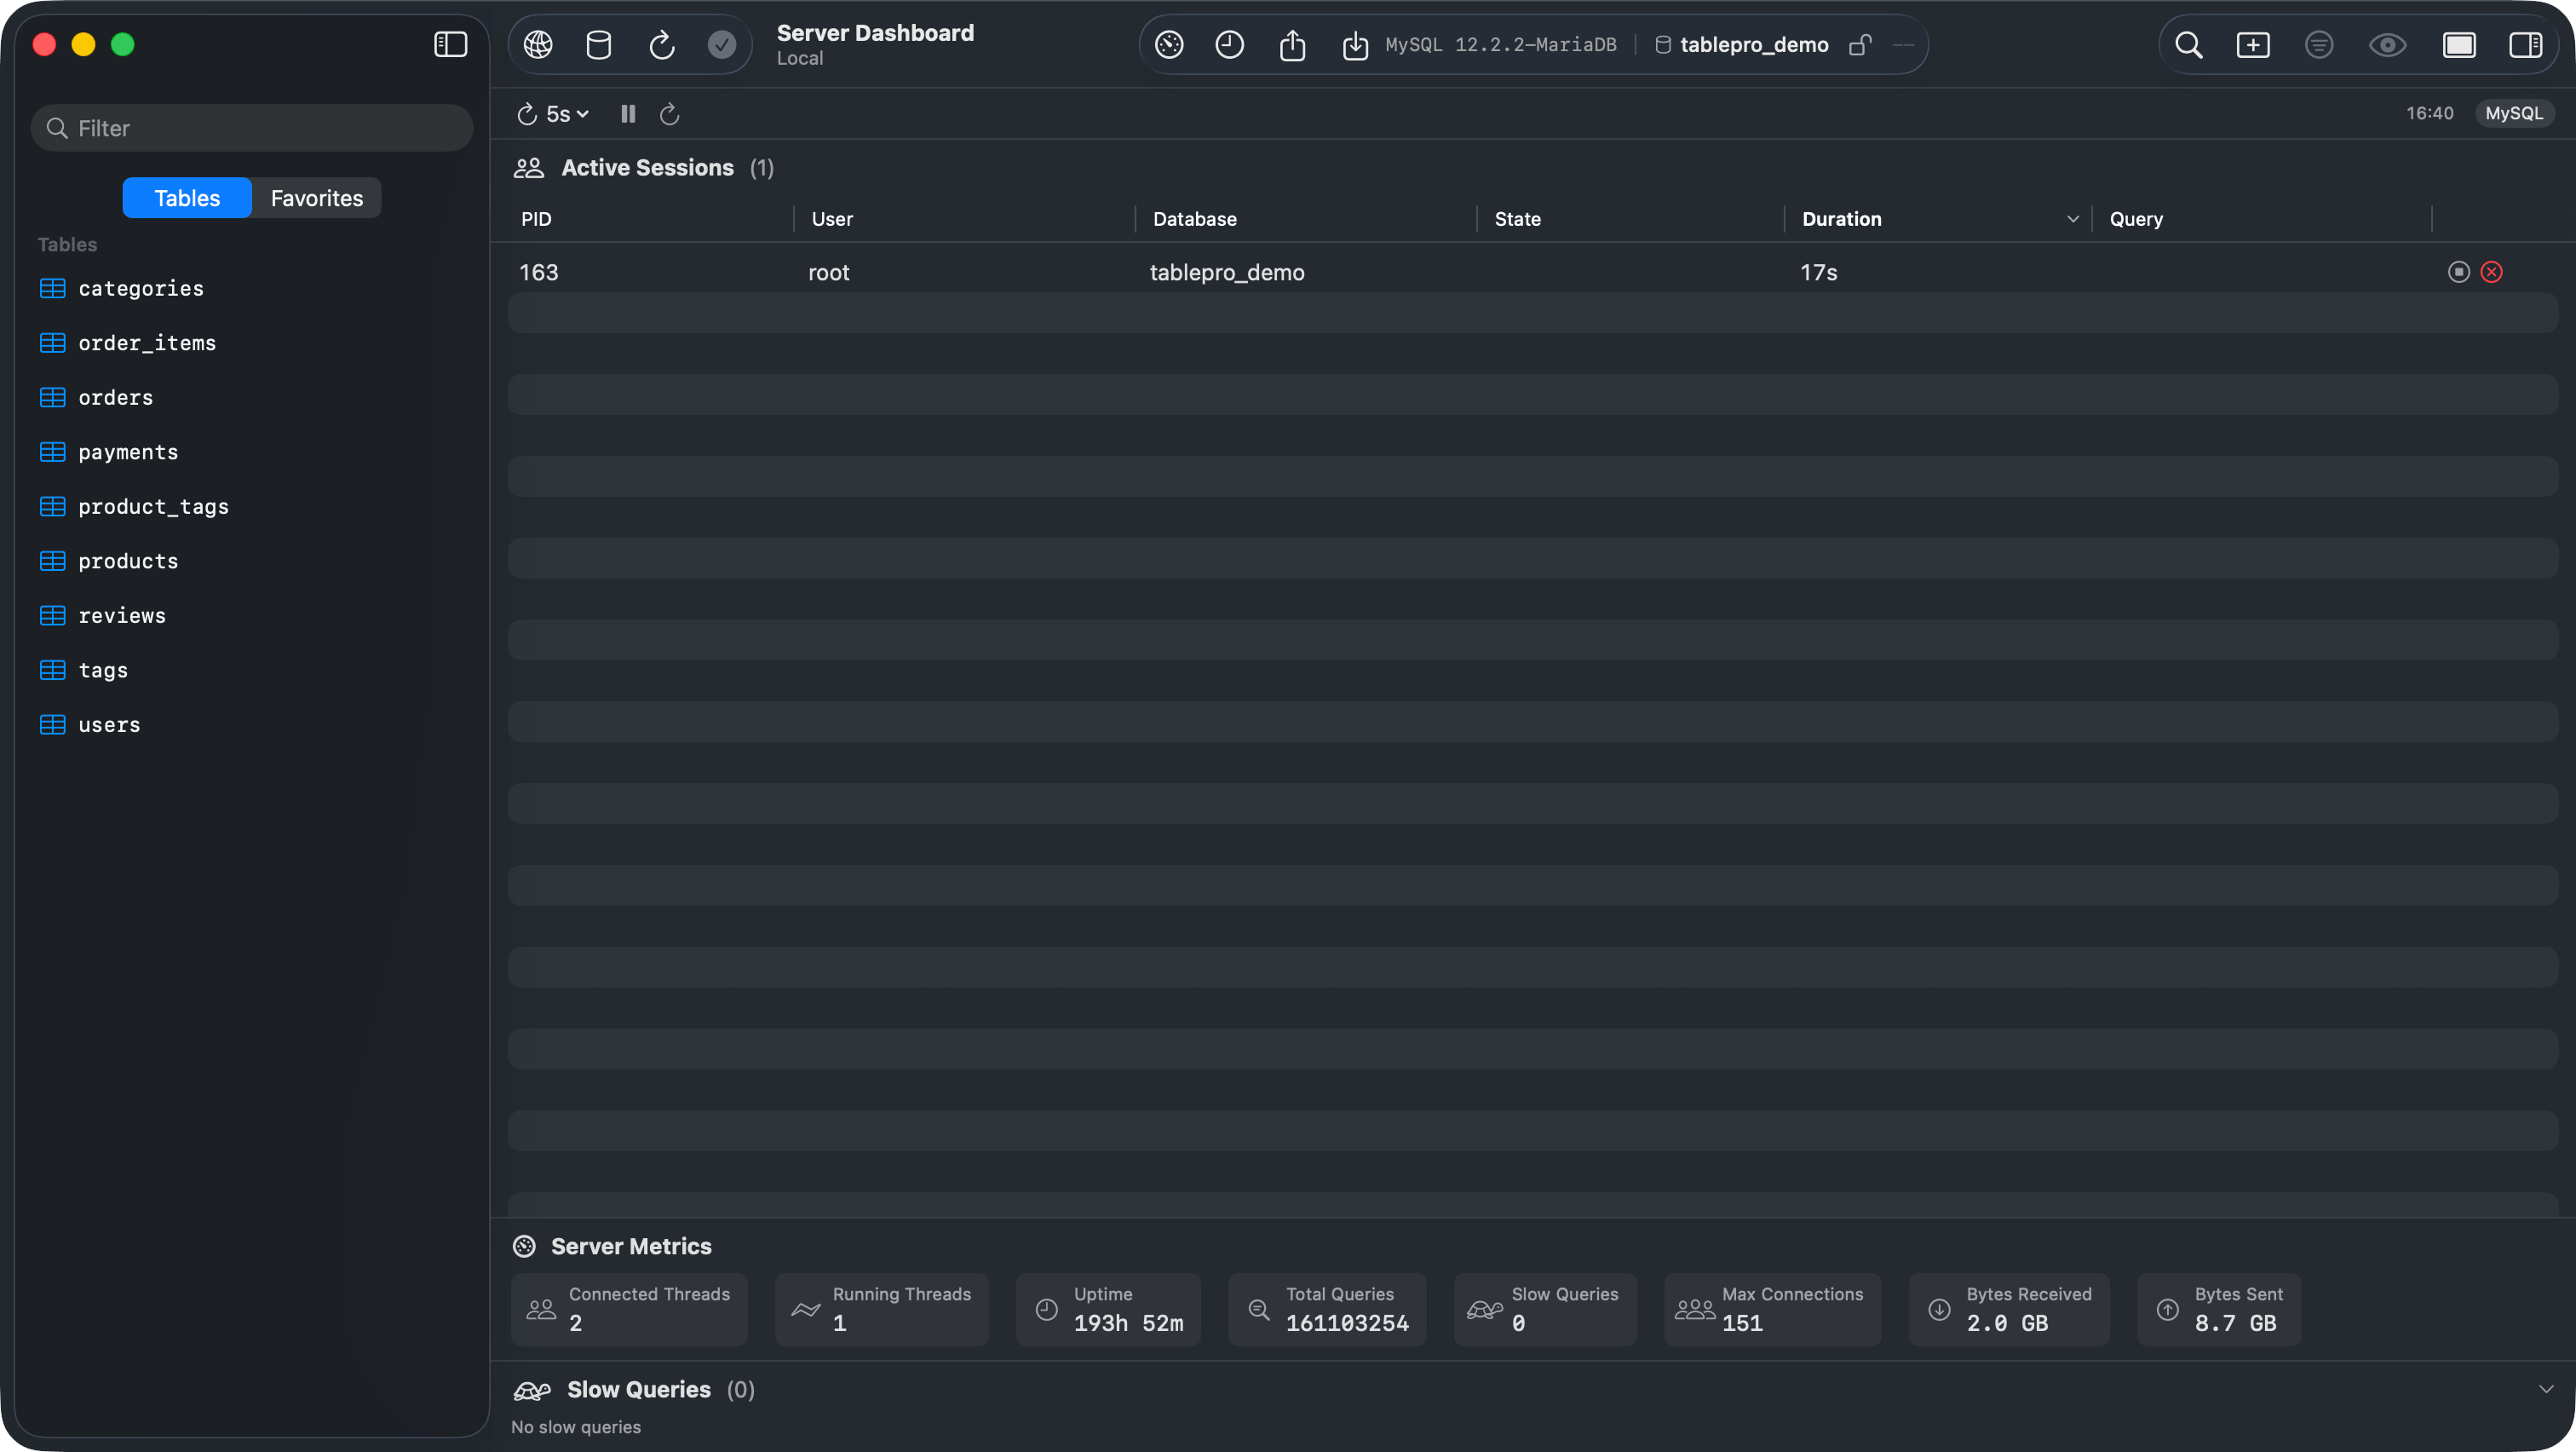
Server Dashboard showing active sessions, metrics, and slow queries
Active Sessions
Every connection to the server except this one, sortable, one row each.
Two buttons sit on each row. Cancel Query stops the running statement and leaves the connection up:
pg_cancel_backend on PostgreSQL, KILL QUERY on MySQL. Terminate Session ends the connection itself with pg_terminate_backend or KILL, and the server rolls back any transaction that session had open. Both confirm first, and a refusal from the server comes back as an Action Failed alert.
Slow Queries
Queries still running after 1 second, longest first, with elapsed time, SQL, user, and database. ClickHouse is the exception: its list comes fromsystem.query_log, so it holds the 20 most recent finished queries that took over a second, newest first, and no database.
Refreshing
The interval menu offers 1s, 2s, 5s (the default), 10s, 30s, and Off. Pause stops the cycle without changing the interval and is dimmed while the interval is Off. Refresh Now runs a single pass. The time of the last refresh sits on the right.What each engine reports
Every other engine has no dashboard provider, so the menu item and the toolbar button are dimmed.